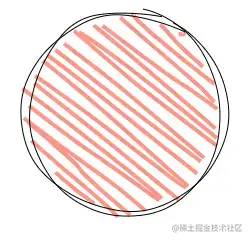
【Web技术】1139- 手把手教你实现手绘风格图形
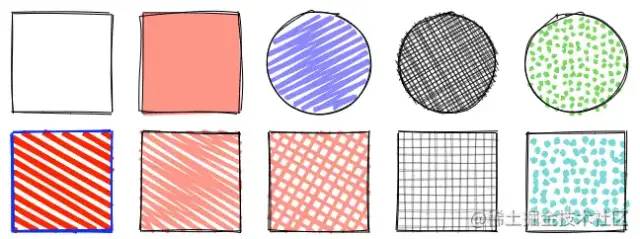
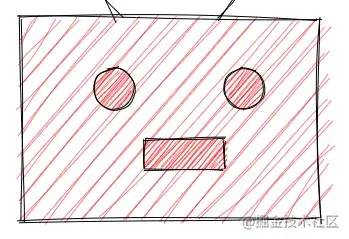
大家好,今天分享一篇高难度的图形绘制文章。Rough.js[1]是一个手绘风格的图形库,提供了一些基本图形的绘制能力,比如:

import rough from 'roughjs/bundled/rough.esm.js'

this.rc = rough.canvas(this.$refs.canvas)
this.rc.rectangle(100, 150, 300, 200, {
    fillweight: 0,
    roughness: 3
})
this.rc.circle(195, 220, 40, {
    fill: 'red'
})
this.rc.circle(325, 220, 40, {
    fill: 'red'
})
this.rc.rectangle(225, 270, 80, 30, {
    fill: 'red',
    fillweight: 5
})
this.rc.line(200, 150, 150, 80, { roughness: 5 })
this.rc.line(300, 150, 350, 80, { roughness: 2 })
效果如下:

线段
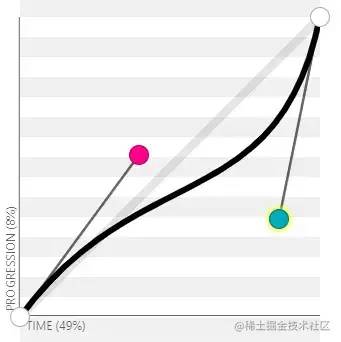
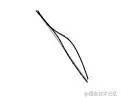
万物基于线段,所以先来看线段怎么画,仔细看上图会发现手绘版线段其实是用两根弯曲的线段组成的,曲线可以使用贝塞尔曲线来画,这里使用三次贝塞尔曲线,那么剩下的问题就是求起点、终点、两个控制点的坐标了。贝塞尔曲线可以在这个网站上尝试:cubic-bezier.com/[3]。首先一条线段的起点和终点我们都给它加一点随机值,随机值比如就在[-2,2]之间,也可以把这个范围和线段的长度关联起来,比如线段越长,随机值就越大。
import rough from 'roughjs/bundled/rough.esm.js'

this.rc = rough.canvas(this.$refs.canvas)
this.rc.rectangle(100, 150, 300, 200, {
    fillweight: 0,
    roughness: 3
})
this.rc.circle(195, 220, 40, {
    fill: 'red'
})
this.rc.circle(325, 220, 40, {
    fill: 'red'
})
this.rc.rectangle(225, 270, 80, 30, {
    fill: 'red',
    fillweight: 5
})
this.rc.line(200, 150, 150, 80, { roughness: 5 })
this.rc.line(300, 150, 350, 80, { roughness: 2 })
接下来就是两个控制点,我们把控制点限定在线段所在的矩形内:
_line (x1, y1, x2, y2) {
    let result = []
    // 起始点
    // ...
    // 终点
    // ...
    // 两个控制点
    let xo = x2 - x1
    let yo = y2 - y1
    let randomFn = (x) => {
        return x > 0 ? this.random(0, x) : this.random(x, 0)
    }
    result[4] = x1 + randomFn(xo)
    result[5] = y1 + randomFn(yo)
    result[6] = x1 + randomFn(xo)
    result[7] = y1 + randomFn(yo)
    return result
}
然后把上面生成的曲线绘制出来:
// 绘制手绘线段
line (x1, y1, x2, y2) {
 this.drawDoubleLine(x1, y1, x2, y2)
}

// 绘制两条曲线
drawDoubleLine (x1, y1, x2, y2) {
    // 绘制生成的两条曲线
    let line1 = this._line(x1, y1, x2, y2)
    let line2 = this._line(x1, y1, x2, y2)
    this.drawLine(line1)
    this.drawLine(line2)
}

// 绘制单条曲线
drawLine (line) {
    this.ctx.beginPath()
    this.ctx.moveTo(line[0], line[1])
    // bezierCurveTo方法前两个点为控制点,第三个点为结束点
    this.ctx.bezierCurveTo(line[4], line[5], line[6], line[7], line[2], line[3])
    this.ctx.strokeStyle = '#000'
    this.ctx.stroke()
}
效果如下:
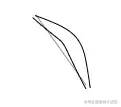

_line (x1, y1, x2, y2) {
    let result = []
    // ...
    // 两个控制点
    let c1 = this.getNearRandomPoint(x1, y1, x2, y2)
    let c2 = this.getNearRandomPoint(x1, y1, x2, y2)
    result[4] = c1[0]
    result[5] = c1[1]
    result[6] = c2[0]
    result[7] = c2[1]
    return result
}

// 计算两个点连成的线段上附近的一个随机点
getNearRandomPoint (x1, y1, x2, y2) {
    let xo, yo, rx, ry
    // 垂直x轴的线段特殊处理
    if (x1 === x2) {
        yo = y2 - y1
        rx = x1 + this.random(-2, 2)// 在横坐标附近找一个随机点
        ry = y1 + yo * this.random(0, 1)// 在线段上找一个随机点
        return [rx, ry]
    }
    xo = x2 - x1
    rx = x1 + xo * this.random(0, 1)// 找一个随机的横坐标
    ry = ((rx - x1) * (y2 - y1)) / (x2 - x1) + y1// 通过两点式求出直线方程
    ry += this.random(-2, 2)// 纵坐标加一点随机值
    return [rx, ry]
}
看一下效果:
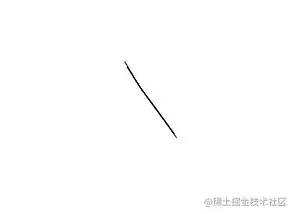
Rough.js比起来还是不够好,有兴趣的可以自行去看一下源码,反正笔者是看不懂,控制变量太多,还没有注释。
多边形&矩形
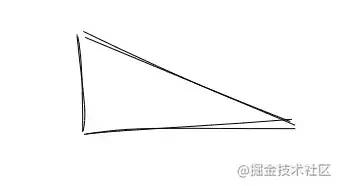
多边形就是把多个点首尾相连起来,遍历顶点调用绘制线段的方法即可:
// 绘制手绘多边形
polygon (points = [], opt = {}) {
    if (points.length < 3) {
        return
    }
    let len = points.length
    for (let i = 0; i < len - 1; i++) {
        this.line(points[i][0], points[i][1], points[i + 1][0], points[i + 1][1])
    }
    // 首尾相连
    this.line(points[len - 1][0], points[len - 1][1], points[0][0], points[0][1])
}
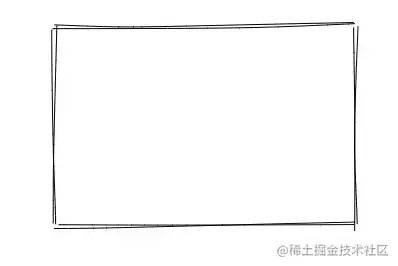
// 绘制手绘矩形
rectangle (x, y, width, height, opt = {}) {
    let points = [
        [x, y],
        [x + width, y],
        [x + width, y + height],
        [x, y + height]
    ]
    this.polygon(points, opt)
}
圆
圆要怎么处理呢,首先大家都知道圆是可以使用多边形来近似得到的,只要多边形的边足够多,那么看起来就足够圆,既然不想要太圆,那就把它恢复成多边形好了,多边形上面已经讲过了。恢复成多边形很简单,比如我们要把一个圆变成十边形(具体还原成几边形你也可以和圆的周长关联起来),那么每个边对应的弧度就是2*Math.PI/10,然后使用Math.cos和Math.sin来计算顶点的位置,最后再调用绘制多边形的方法进行绘制:
// 绘制手绘圆
circle (x, y, r) {
    let stepCount = 10
    let step = (2 * Math.PI) / stepCount
    let points = []
    for (let angle = 0; angle < 2 * Math.PI; angle += step) {
        let p = [
            x + r * Math.cos(angle),
            y + r * Math.sin(angle)
        ]
        points.push(p)
    }
    this.polygon(points)
}
效果如下:
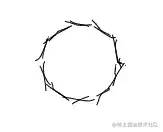
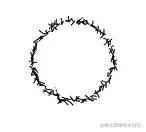
circle (x, y, r) {
    let stepCount = 10
    let step = (2 * Math.PI) / stepCount
    let points = []
    let rx = r + this.random(-r * 0.05, r * 0.05)
    let ry = r + this.random(-r * 0.05, r * 0.05)
    for (let angle = 0; angle < 2 * Math.PI; angle += step) {
        let p = [
            x + rx * Math.cos(angle) + this.random(-2, 2),
            y + ry * Math.sin(angle) + this.random(-2, 2)
        ]
        points.push(p)
    }
}接下来的问题又变成了计算贝塞尔曲线的两个控制点,首先因为弧线肯定是要往多边形外凸的,根据贝塞尔曲线的性质,两个控制点一定是在线段的外面,直接用线段本身的两个端点来计算的话我试了一下,比较难处理,不同的角度可能都需要特殊处理,所以我们参考Rough.js间隔一个点:
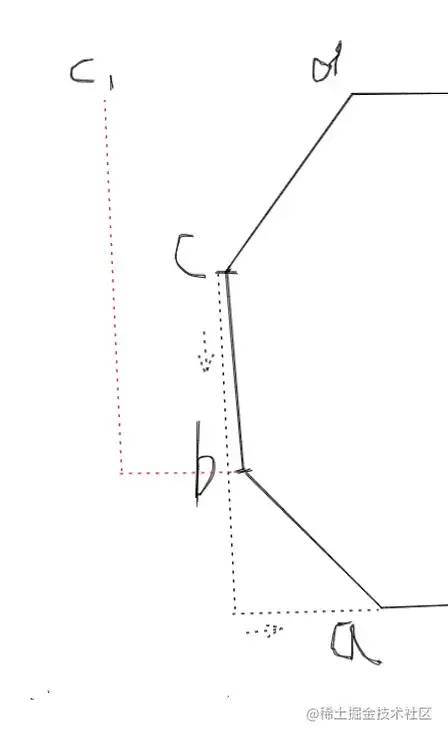
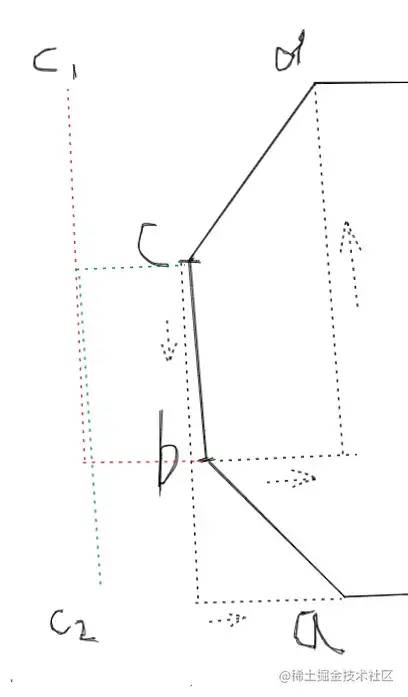
bc,对于点b来说上一个点是a,下一个点是c,b点分别加上c减a的横坐标纵坐标之差,得到了控制点c1,其他点也是一样,最后算出来的控制点都会在外面,现在还差一个控制点,我们不要让点c闲着,也给它加上前后两点之差:

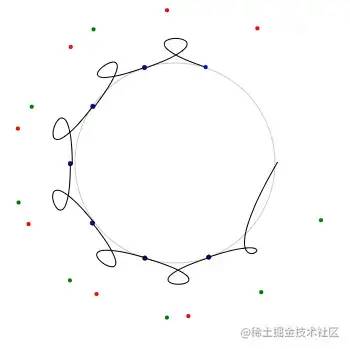
c的控制点c2和c1都在同一侧,这样画出来的曲线显然是朝一个方向的:
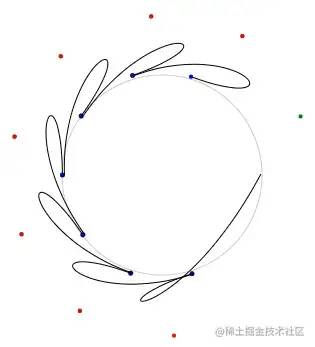
c的前一个点减后一个点:
circle (x, y, r) {
    // ...
    let len = points.length
    this.ctx.beginPath()
    // 路径的起点移到第一个点
    this.ctx.moveTo(points[0][0], points[0][1])
    this.ctx.strokeStyle = '#000'
    for (let i = 1; i + 2 < len; i++) {
        let c1, c2, c3
        let point = points[i]
        // 控制点1
        c1 = [
            point[0] + (points[i + 1][0] - points[i - 1][0]) / 5,
            point[1] + (points[i + 1][1] - points[i - 1][1]) / 5
        ]
        // 控制点2
        c2 = [
            points[i + 1][0] + (point[0] - points[i + 2][0]) / 5,
            points[i + 1][1] + (point[1] - points[i + 2][1]) / 5
        ]
        c3 = [points[i + 1][0], points[i + 1][1]]
        this.ctx.bezierCurveTo(
            c1[0],
            c1[1],
            c2[0],
            c2[1],
            c3[0],
            c3[1]
        )
    }
    this.ctx.stroke()
}我们只加差值的五分之一,我试了一下,5-7之间最自然,Rough.js加的是六分之一。
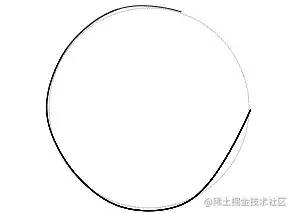
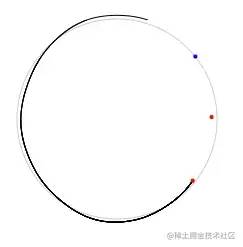
i + 2 < len的循环条件导致最后一个点没连上,另外首尾也没有相连,此外开头一段很不自然,太直了,原因是我们路径的起点是从第一个点开始的,但是我们的第一段曲线的结束点已经是第三个点了,所以先把路径的起点移到第二个点:
this.ctx.moveTo(points[1][0], points[1][1])
这样缺口就更大了:
// 把前三个点追加到列表最后
points.push([points[0][0], points[0][1]], [points[1][0], points[1][1]], [points[2][0], points[2][1]])
let len = points.length
this.ctx.beginPath()
// ...
效果如下:
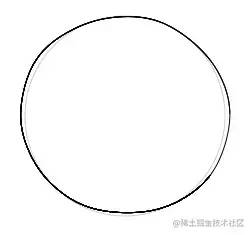
let end = [] // 处理最后一个连线点,让它和原本的点来点随机偏移
let radRandom = step * this.random(0.1, 0.5)// 让该点超前一点,代表画过头了,也可以来点负数,代表差一点才连上,但是比较丑
end[0] = x + rx * Math.cos(step + radRandom)// 要连的最后一个点实际上是列表里的第二个点,所以角度是step而不是0
end[1] = y + ry * Math.sin(step + radRandom)
points.push(
    [points[0][0], points[0][1]],
    [end[0], end[1]],
    [points[2][0], points[2][1]]
)
let len = points.length
this.ctx.beginPath()
//...最后一个要优化的点是起点或者说终点位置,一般来说我们徒手画圆都是从上面开始画,因为0度是在x轴正轴方向,所以我们减去Math.PI/2左右就能把起点移到上方,最后完整的代码如下:
drawCircle (x, y, r) {
    // 圆变多边形
    let stepCount = 10
    let step = (2 * Math.PI) / stepCount// 多边形的一条边对应的角度
    let startOffset = -Math.PI / 2 + this.random(-Math.PI / 4, Math.PI / 4)// 起点偏移角度
    let points = []
    let rx = r + this.random(-r * 0.05, r * 0.05)
    let ry = r + this.random(-r * 0.05, r * 0.05)
    for (let angle = startOffset; angle < (2 * Math.PI + startOffset); angle += step) {
        let p = [
            x + rx * Math.cos(angle) + this.random(-2, 2),
            y + ry * Math.sin(angle) + this.random(-2, 2)
        ]
        points.push(p)
    }
    // 线段变曲线
    let end = [] // 处理最后一个连线点,让它和原本的点来点随机偏移
    let radRandom = step * this.random(0.1, 0.5)
    end[0] = x + rx * Math.cos(startOffset + step + radRandom)
    end[1] = y + ry * Math.sin(startOffset + step + radRandom)
    points.push(
        [points[0][0], points[0][1]],
        [end[0], end[1]],
        [points[2][0], points[2][1]]
    )
    let len = points.length
    this.ctx.beginPath()
    this.ctx.moveTo(points[1][0], points[1][1])
    this.ctx.strokeStyle = '#000'
    for (let i = 1; i + 2 < len; i++) {
        let c1, c2, c3
        let point = points[i]
        let num = 6
        c1 = [
            point[0] + (points[i + 1][0] - points[i - 1][0]) / num,
            point[1] + (points[i + 1][1] - points[i - 1][1]) / num
        ]
        c2 = [
            points[i + 1][0] + (point[0] - points[i + 2][0]) / num,
            points[i + 1][1] + (point[1] - points[i + 2][1]) / num
        ]
        c3 = [points[i + 1][0], points[i + 1][1]]
        this.ctx.bezierCurveTo(c1[0], c1[1], c2[0], c2[1], c3[0], c3[1])
    }
    this.ctx.stroke()
}
最后的最后,也可以和上面的线段一样画两次,综合效果如下:

填充
样式1
先来看一种比较简单的填充:
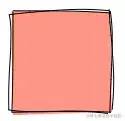
canvas的fill方法,所以需要把这四段曲线首尾连起来:
// 绘制手绘多边形
polygon (points = [], opt = {}) {
    if (points.length < 3) {
        return
    }
    // 加上填充方法
    let lines = this.closeLines(points)
    this.fillLines(lines, opt)

    // 描边
    let len = points.length
    // ...
}closeLines方法用来把顶点闭合成曲线:
// 把多边形的顶点转换成首尾相连的闭合线段
closeLines (points) {
    let len = points.length
    let lines = []
    let lastPoint = null
    for (let i = 0; i < len - 1; i++) {
        // _line方法上文已经实现了,把直线段转换成曲线
        let arr = this._line(
            points[i][0],
            points[i][1],
            points[i + 1][0],
            points[i + 1][1]
        )
        lines.push([
            lastPoint ? lastPoint[2] : arr[0], // 上一个点存在则使用上一个点的终点来作为该点的起点
            lastPoint ? lastPoint[3] : arr[1],
            arr[2],
            arr[3],
            arr[4],
            arr[5],
            arr[6],
            arr[7]
        ])
        lastPoint = arr
    }
    // 首尾闭合
    let arr = this._line(
        points[len - 1][0],
        points[len - 1][1],
        points[0][0],
        points[0][1]
    )
    lines.push([
        lastPoint ? lastPoint[2] : arr[0],
        lastPoint ? lastPoint[3] : arr[1],
        lines[0][0], // 终点是第一条线段的起点
        lines[0][1],
        arr[4],
        arr[5],
        arr[6],
        arr[7]
    ])
    return lines
}线段有了,只要遍历线段绘制出来最后调用fill方法即可:
// 填充多边形
fillLines (lines, opt) {
    this.ctx.beginPath()
    this.ctx.fillStyle = opt.fillStyle
    for (let i = 0; i + 1 < lines.length; i++) {
        let line = lines[i]
        if (i === 0) {
            this.ctx.moveTo(line[0], line[1])
        }
        this.ctx.bezierCurveTo(
            line[4],
            line[5],
            line[6],
            line[7],
            line[2],
            line[3]
        )
    }
    this.ctx.fill()
}
效果如下:
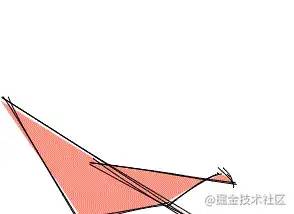
// 下面几行代码都给去掉,使用原本的点即可
let end = []
let radRandom = step * this.random(0.1, 0.5)
end[0] = x + rx * Math.cos(startOffset + step + radRandom)
end[1] = y + ry * Math.sin(startOffset + step + radRandom)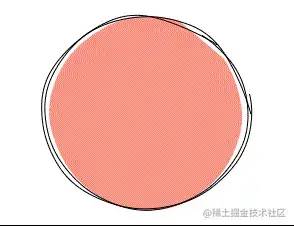
样式2
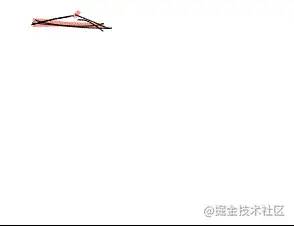
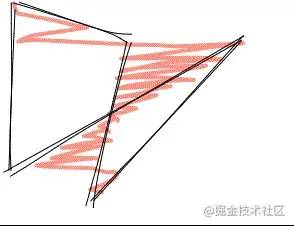
第二种填充会稍微复杂一点,比如下面这种最简单的填充,其实就是一些倾斜的线段,但问题是这些线段的端点怎么确定,矩形当然可以暴力的算出来,但是不规则的多边形怎么办,所以需要找到一个通用的方法。
Rough.js用的也是这种方法,所以接下来介绍一下这个算法。扫描线填充很简单,就是一条扫描线(水平线)从多边形的底部开始往上扫描,那么每条扫描线都会和多边形有交点,同一条扫描线和多边形的各个交点之间的区域就是我们要填充的,那么问题来了,怎么确定交点,以及怎么判断两个交点之间属于多边形内部。
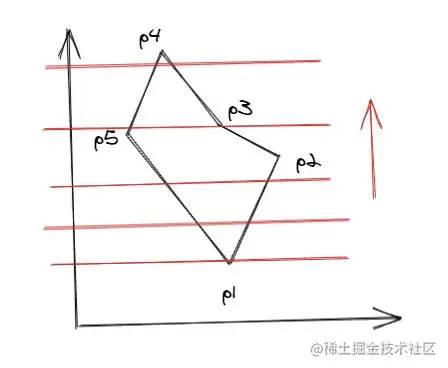
y坐标是已知的,就是扫描线的y坐标,那么只要求出x,知道线段的两个端点坐标,那么可以求出直线方程,然后再计算,但是有一种更简单的方法,就是利用边的相关性,也就是知道了线段上的某一点,其相邻的点可以轻松的根据该点求出,下面是推导过程:
// 设直线方程
y = kx + b
// 设两点:c(x3, y3),d点的y坐标为c点y坐标+1,d(x4, y3 + 1),那么要求出x4
y3 = kx3 + b// 1
y3 + 1 = kX4 + b// 2
// 1式代入2式
kx3 + b + 1 = kX4 + b
kx3 + 1 = kX4// 约去b
X4 = x3 + 1 / k// 两边同时除k
// 所以y坐标+1,x坐标为上一个点的x坐标加上直线斜率的倒数
// 多边形的线段是已知两个点的,假设为a(x1, y1)、b(x2, y2),那么斜率k如下:
k = (y2 - y1) /
// 斜率的倒数也就是
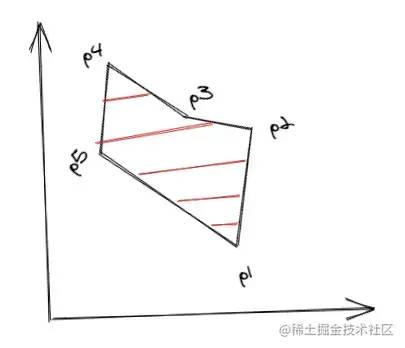
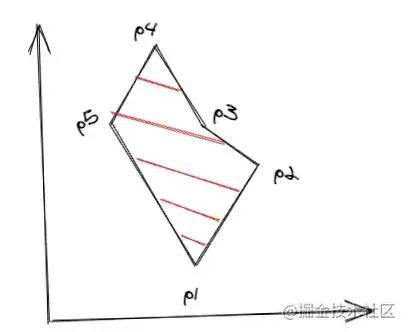
1/k = (x2 - x1) / (y2 - y1)这样我们从线段的一个端点开始,可以挨个计算出线段上的所有点。详细的算法介绍和推导过程可以看一下这个PPT:wenku.baidu.com/view/4ee141…[4],接下来直接来看算法的实现过程。先简单介绍一下几个名词:1.边表ET边表ET,一个数组,里面保存了多边形所有边的信息,每条边保存的信息有:该边y的最大值ymax和最小值ymin、该边最低点的x值xi、该边斜率的倒数dx。边按ymin递增排序,ymin相同则按xi递增,xi也相同则只能看ymax,如果ymax还相同,说明两条边重合了,如果不重合,则按yamx递增排序。2.活动边表AET也是一个数组,里面保存着与当前扫描线相交的边信息,随着扫描线的扫描会发生变化,删除不相交的,添加新相交的。该表里的边按xi递增排序。比如下面的多边形ET表顺序为:
// ET
[p1p5, p1p2, p5p4, p2p3, p4p3]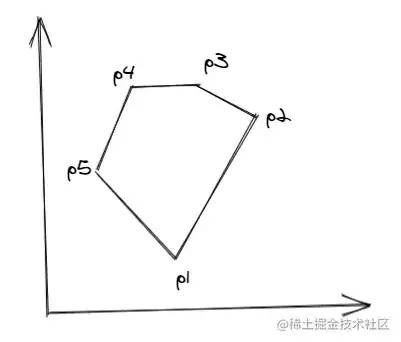
ET表edgeTable,按上述顺序排序;2.创建一个空的AET表activeEdgeTable;3.开始扫描,扫描线的y=多边形的最低点的y值,也就是activeEdgeTable[0].ymin;4.重复下面步骤,直到ET表和AET表都为空:(1)从ET表里取出与当前扫描线相交的边,添加到AET表里,同样按上面提到的顺序排序 (2)成对取出AET表里的边信息的xi值,在每对之间进行填充 (3)从AET表里删除当前已经扫描到最后的边,即y >= ymax (4)更新AET表里剩下的边信息的xi,即xi = xi + dx (5)更新扫描线的y,即y = y + 1看着并不难,接下来转化成代码,先创建一下边表ET:
// 创建排序边表ET
createEdgeTable (points) {
    // 边表ET
    let edgeTable = []
    // 将第一个点复制一份到队尾,用来闭合多边形
    let _points = points.concat([[points[0][0], points[0][1]]])
    let len = _points.length
    for (let i = 0; i < len - 1; i++) {
        let p1 = _points[i]
        let p2 = _points[i + 1]
        // 过滤掉平行于x轴的线段,详见上述PPT链接
        if (p1[1] !== p2[1]) {
            let ymin = Math.min(p1[1], p2[1])
            edgeTable.push({
                ymin,
                ymax: Math.max(p1[1], p2[1]),
                xi: ymin === p1[1] ? p1[0] : p2[0], // 最低顶点的x值
                dx: (p2[0] - p1[0]) / (p2[1] - p1[1]) // 线段的斜率的倒数
            })
        }
    }
    // 对边表进行排序
    edgeTable.sort((e1, e2) => {
        // 按ymin递增排序
        if (e1.ymin < e2.ymin) {
            return -1
        }
        if (e1.ymin > e2.ymin) {
            return 1
        }
        // ymin相同则按xi递增
        if (e1.xi < e2.xi) {
            return -1
        }
        if (e1.xi > e2.xi) {
            return 1
        }
        // xi也相同则只能看ymax
        // ymax还相同,说明两条边重合
        if (e1.ymax === e2.ymax) {
            return 0
        }
        // 如果不重合,则按yamx递增排序
        if (e1.ymax < e2.ymax) {
            return -1
        }
        if (e1.ymax > e2.ymax) {
            return 1
        }
    })
    return edgeTable
}
接下来进行扫描操作:
scanLines (points) {
    if (points.length < 3) {
        return []
    }
    let lines = []
    // 创建排序边表ET
    let edgeTable = this.createEdgeTable(points)
    // 活动边表AET
    let activeEdgeTable = []
    // 开始扫描,从多边形的最低点开始
    let y = edgeTable[0].ymin
    // 循环的终点是两个表都为空
    while (edgeTable.length > 0 || activeEdgeTable.length > 0) {
        // 从ET表里把当前扫描线的边添加到AET表里
        if (edgeTable.length > 0) {
            // 将当前ET表里和扫描线相交的边添加到AET表里
            for (let i = 0; i < edgeTable.length; i++) {
                // 如果扫描线的间隔加大,可能高低差比较小的线段会被整个直接跳过,导致死循环,需要考虑到这种情况
                if (edgeTable[i].ymin <= y && edgeTable[i].ymax >= y || edgeTable[i].ymax < y) {
                    let removed = edgeTable.splice(i, 1)
                    activeEdgeTable.push(...removed)
                    i--
                }
            }
        }
        // 从AET表里删除y=ymax的记录
        activeEdgeTable = activeEdgeTable.filter((item) => {
            return y < item.ymax
        })
        // 按xi从小到大排序
        activeEdgeTable.sort((e1, e2) => {
            if (e1.xi < e2.xi) {
                return -1
            } else if (e1.xi > e2.xi) {
                return 1
            } else {
                return 0
            }
        })
        // 如果存在活动边,则填充活动边之间的区域
        if (activeEdgeTable.length > 1) {
            // 每次取两个边出来进行填充
            for (let i = 0; i + 1 < activeEdgeTable.length; i += 2) {
                lines.push([
                    [Math.round(activeEdgeTable[i].xi), y],
                    [Math.round(activeEdgeTable[i + 1].xi), y]
                ])
            }
        }
        // 更新活动边的xi
        activeEdgeTable.forEach((item) => {
            item.xi += item.dx
        })
        // 更新扫描线y
        y += 1
    }
    return lines
}
代码其实就是上述算法过程的翻译,理解了算法代码并不难理解,在多边形方法里调用一下该方法:
// 绘制手绘多边形
polygon (points = [], opt = {}) {
    if (points.length < 3) {
        return
    }
    // 加上填充方法
    let lines = this.scanLines(points)
    lines.forEach((line) => {
        this.drawDoubleLine(line[0][0], line[0][1], line[1][0], line[1][1], {
            color: opt.fillStyle
        })
    })

    // 描边
    let len = points.length
    // ...
}
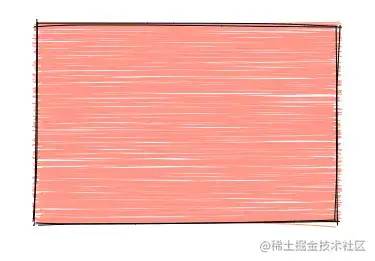
看一下最后的填充效果:
scanLines (points) {
    // ...

    // 我们让扫描线每次加10
    let gap = 10
    // 更新活动边的xi
    activeEdgeTable.forEach((item) => {
        item.xi += item.dx * gap// 斜率的倒数为什么也要乘10可以去看上面的推导过程
    })
    // 更新扫描线y
    y += gap

    // ...
}
顺便也加粗一下线段的宽度,效果如下:
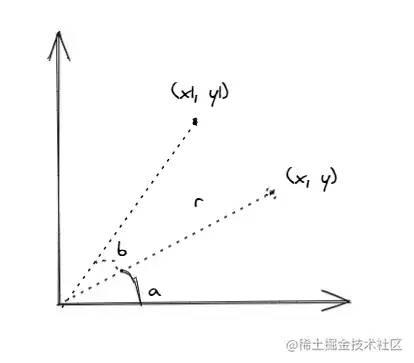
(x,y)原本的角度为a,线段长为r,求旋转角度b后的坐标(x1,y1):
x = Math.cos(a) * r// 1
y = Math.sin(a) * r// 2

x1 = Math.cos(a + b) * r
y1 = Math.sin(a + b) * r

// 把cos(a+b)、sin(a+b)展开
x1 = (Math.cos(a) * Math.cos(b) - Math.sin(a) * Math.sin(b)) * r// 3
y1 = (Math.sin(a) * Math.cos(b) + Math.cos(a) * Math.sin(b)) * r// 4

// 把1式和2式代入3式和4式
Math.cos(a) = x / r
Math.sin(a) = y / r
x1 = ((x / r) * Math.cos(b) - (y / r) * Math.sin(b)) * r
y1 = ((y / r) * Math.cos(b) + (x / r) * Math.sin(b)) * r
// 约去r
x1 = x * Math.cos(b) - y * Math.sin(b)
y1 = y * Math.cos(b) + x * Math.sin(b)
由此可以得到求一个点旋转指定角度后的坐标的函数:
getRotatedPos (x, y, rad) {
    return [
        x: x * Math.cos(rad) - y * Math.sin(rad),
        y: y * Math.cos(rad) + x * Math.sin(rad)
    ]
}
有了该函数我们就可以来旋转多边形了:
// 绘制手绘多边形
polygon (points = [], opt = {}) {
    if (points.length < 3) {
        return
    }
    // 扫描前先旋转多边形
    let _points = this.rotatePoints(points, opt.rotate)
    let lines = this.scanLines(_points)
    // 扫描完得到的线段我们再旋转相反的角度
    lines = this.rotateLines(lines, -opt.rotate)
    lines.forEach((line) => {
        this.drawDoubleLine(line[0][0], line[0][1], line[1][0], line[1][1], {
            color: opt.fillStyle
        })
    })

    // 描边
    let len = points.length
    // ...
}

// 旋转顶点列表
rotatePoints (points, rotate) {
    return points.map((item) => {
        return this.getRotatedPos(item[0], item[1], rotate)
    })
}

// 旋转线段列表
rotateLines (lines, rotate) {
    return lines.map((line) => {
        return [
            this.getRotatedPos(line[0][0], line[0][1], rotate),
            this.getRotatedPos(line[1][0], line[1][1], rotate)
        ]
    })
}
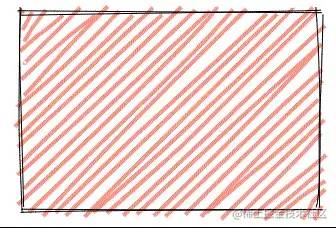
效果如下:
总结
本文介绍了几种简单图形的手绘风格实现方法,其中涉及到了简单的数学知识及区域填充算法,如果有不合理或更好的实现方式请在留言区讨论吧,完整的示例代码在:github.com/wanglin2/ha…[5]。感谢阅读,下次再会~参考文章:
- https://github.com/rough-stuff/rough
- https://wenku.baidu.com/view/4ee141347c1cfad6195fa7c9.html
- https://blog.csdn.net/orbit/article/details/7368996
- https://blog.csdn.net/wodownload2/article/details/52154207
- https://blog.csdn.net/keneyr/article/details/83747501
- http://www.twinklingstar.cn/2013/325/region-polygon-fill-scan-line/
参考资料
[1]https://roughjs.com/
[2]http://lxqnsys.com/#/demo/handPaintedStyle
[3]https://cubic-bezier.com
[4]https://wenku.baidu.com/view/4ee141347c1cfad6195fa7c9.html
[5]https://github.com/wanglin2/handPaintedStyle

