Three.js - 实现地图边界炫光路径效果
简介
本节主要使用多个粒子在地图边界,根据时间在不同的位置发光,实现一条发光的线在边界上移动。大家可以先看下效果:

实现思路
- 获取地图边界「GeoJSON数据」。
- 根据数据创建地图线框,在每个数据点上创建全透明粒子。
- 通过
requestAnimationFrame()函数,修改不同位置粒子的透明度。
实现
基础模版
<!DOCTYPE html>
<html lang="en">
  <head>
    <meta charset="UTF-8" />
    <title>学习</title>
  </head>
  <body>
    <canvas id="c2d" class="c2d" width="1000" height="500"></canvas>
    <script src="https://d3js.org/d3.v5.min.js"></script>
    <script type="module">
      import * as THREE from './file/three.js-dev/build/three.module.js'
      import { OrbitControls } from './file/three.js-dev/examples/jsm/controls/OrbitControls.js'

      const canvas = document.querySelector('#c2d')
      // 渲染器
      const renderer = new THREE.WebGLRenderer({ canvas })

      const fov = 40 // 视野范围
      const aspect = 2 // 相机默认值 画布的宽高比
      const near = 0.1 // 近平面
      const far = 10000 // 远平面
      // 透视投影相机
      const camera = new THREE.PerspectiveCamera(fov, aspect, near, far)
      camera.position.set(0, 100, 500)
      camera.lookAt(0, 0, 0)
      // 控制相机
      const controls = new OrbitControls(camera, canvas)
      controls.update()

      // 场景
      const scene = new THREE.Scene()

      // 渲染
      function render() {
        renderer.render(scene, camera)
        requestAnimationFrame(render)
      }
      requestAnimationFrame(render)
    </script>
  </body>
</html>
加载地图数据,绘制地图、自定义几何体
- 绘制中国地图
  const lines = []
  const geometry = new THREE.BufferGeometry()
  let positions = null
  let opacitys = null
  // 以北京为中心 修改坐标
const projection = d3.geoMercator().center([116.412318, 39.909843]).translate([0, 0])- 创建变量
lines保存边界点数据。 - 创建
BufferGeometry()几何体,绘制透明点。
- 绘制线条公用方法,并把边界点信息放入
lines中。
  let indexBol = true
  /**
   * 边框 图形绘制
   * @param polygon 多边形 点数组
   * @param color 材质颜色
   * */
  function lineDraw(polygon, color) {
    const lineGeometry = new THREE.BufferGeometry()
    const pointsArray = new Array()
    polygon.forEach((row) => {
      const [x, y] = projection(row)
      // 创建三维点
      pointsArray.push(new THREE.Vector3(x, -y, 0))

      if (indexBol) {
        lines.push([x, -y, 0])
      }
    })
    indexBol = false
    // 放入多个点
    lineGeometry.setFromPoints(pointsArray)

    const lineMaterial = new THREE.LineBasicMaterial({
      color: color
    })
    return new THREE.Line(lineGeometry, lineMaterial)
}- 这里使用
indexBol变量,是因为我们只需要地图数据第一个数组中的边界点数据。
- 加载地图数据,并创建自定义几何体。
  const loader = new THREE.FileLoader()
  loader.load('./file/100000.json', (data) => {
    const jsondata = JSON.parse(data)

    // 中国边界
    const feature = jsondata.features[0]
    const province = new THREE.Object3D()
    province.properties = feature.properties.name
    // 点数据
    const coordinates = feature.geometry.coordinates

    coordinates.forEach((coordinate) => {
      // coordinate 多边形数据
      coordinate.forEach((rows) => {
        const line = lineDraw(rows, 0xffffff)
        province.add(line)
      })
    })

    positions = new Float32Array(lines.flat(1))
    // 设置顶点
    geometry.setAttribute('position', new THREE.BufferAttribute(positions, 3))
    // 设置 粒子透明度为 0
    opacitys = new Float32Array(positions.length).map(() => 0)
    geometry.setAttribute('aOpacity', new THREE.BufferAttribute(opacitys, 1))

    scene.add(province)
})- 解析地图数据,使用
lineDraw()函数绘制线条和保存边界信息。 - 添加几何体顶点信息(
positions)和每个顶点的透明度信息(opacitys)

使用着色器材质和点网格绘制透明点
- 创建控制变量。
  // 控制 颜色和粒子大小
  const params = {
    pointSize: 2.0,
    pointColor: '#4ec0e9'
}- 定义顶点着色器
  const vertexShader = `
    attribute float aOpacity;
    uniform float uSize;
    varying float vOpacity;

    void main(){
        gl_Position = projectionMatrix*modelViewMatrix*vec4(position,1.0);
        gl_PointSize = uSize;

        vOpacity=aOpacity;
    }
`three.js中的变量。projectionMatrix是投影变换矩阵,modelViewMatrix是相机坐标系的变换矩阵,position顶点坐标。- 通过
uniform全局变量获取外部设置uSize,设置粒子大小。 - 通过
varying变量把顶点对应的透明度aOpacity传入片元着色器。
- 定义片元着色器
  const fragmentShader = `
    varying float vOpacity;
    uniform vec3 uColor;

    float invert(float n){
        return 1.-n;
    }

    void main(){
      if(vOpacity <=0.2){
          discard;
      }
      vec2 uv=vec2(gl_PointCoord.x,invert(gl_PointCoord.y));
      vec2 cUv=2.*uv-1.;
      vec4 color=vec4(1./length(cUv));
      color*=vOpacity;
      color.rgb*=uColor;

      gl_FragColor=color;
    }
`- 通过
uniform全局变量获取外部设置uColor,基础颜色。 - 通过
varying变量获取透明度vOpacity。 - 设置透明度小于
0.2的片元不执行。 - 根据算法获取当前顶点要展示的颜色,这个算法是网上找的,实现发光效果。
- 创建着色器材质,放入点材质中绘制透明点。
  const material = new THREE.ShaderMaterial({
    vertexShader: vertexShader,
    fragmentShader: fragmentShader,
    transparent: true, // 设置透明
    uniforms: {
      uSize: {
        value: params.pointSize
      },
      uColor: {
        value: new THREE.Color(params.pointColor)
      }
    }
  })
  const points = new THREE.Points(geometry, material)
scene.add(points)- 放入顶点和片元着色器,设置
uniforms全局变量。 - 创建
Points()网格,绘制透明点,加入场景。
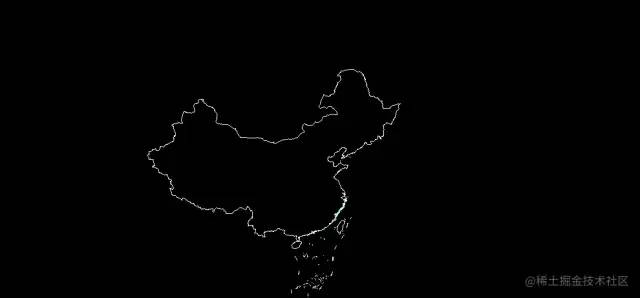
- 现在所有点都是透明的和上一张图无区别。
修改粒子透明度形成炫光效果
  let currentPos = 0
  let pointSpeed = 20 // 速度
  // 渲染
  function render() {
    if (points && geometry.attributes.position) {
      currentPos += pointSpeed
      for (let i = 0; i < pointSpeed; i++) {
        opacitys[(currentPos - i) % lines.length] = 0
      }

      for (let i = 0; i < 200; i++) {
        opacitys[(currentPos + i) % lines.length] = i / 50 > 2 ? 2 : i / 50
      }
      geometry.attributes.aOpacity.needsUpdate = true
    }

    renderer.render(scene, camera)
    requestAnimationFrame(render)
}- 两个循环,第一个清除上一次粒子透明度的修改。第二个设置炫光长度和修改粒子的透明度。
.needsUpdate必须设置,设置后着色器中的顶点信息才会修改。
