爷青回!用原生 Audio API 实现一个千千静听
前言
最近看了一下钟文泽的 Macbook Pro 测评视频(唉,最近又想买电子产品了),他在测评音响的时候,点播了一首蔡琴的《渡口》。

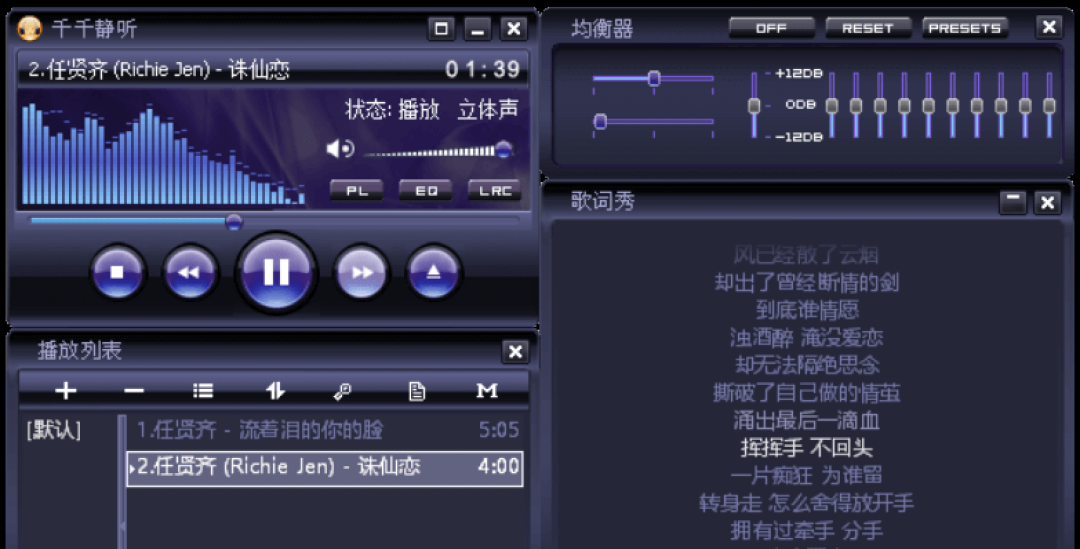
项目已经放在 Github[1],也可以在 这里预览[2]
由于原来的拟物风格实现太难实现了,只能做个粗糙的版本 :)
解决思路
首先我们要理解频谱图里的这些“长条”是什么意思。实际上这是音频里的 频率 Frequency,我们常说的低音炮和美高音就是指在声音在低频区和高频区的表现。
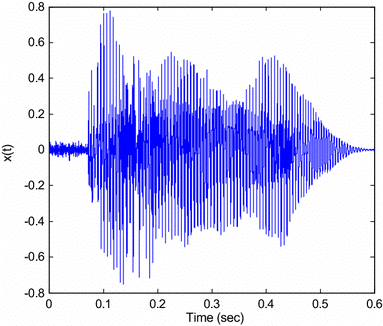
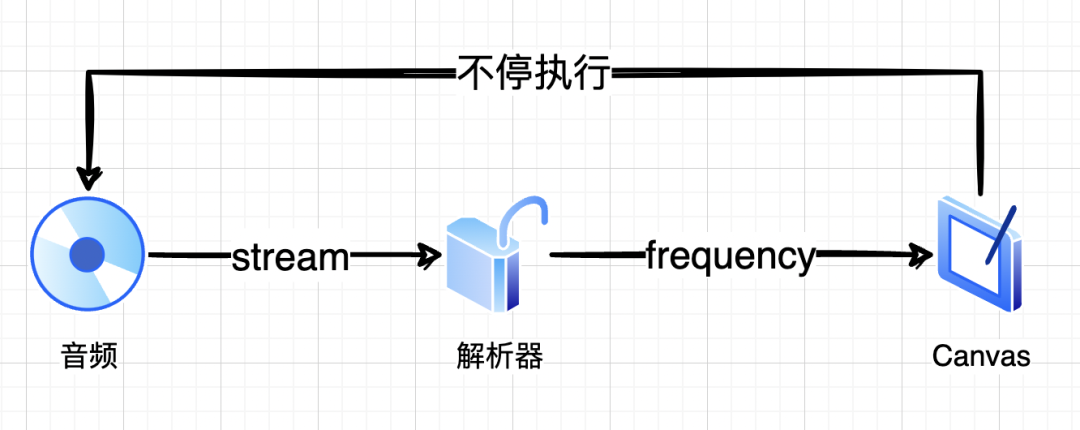
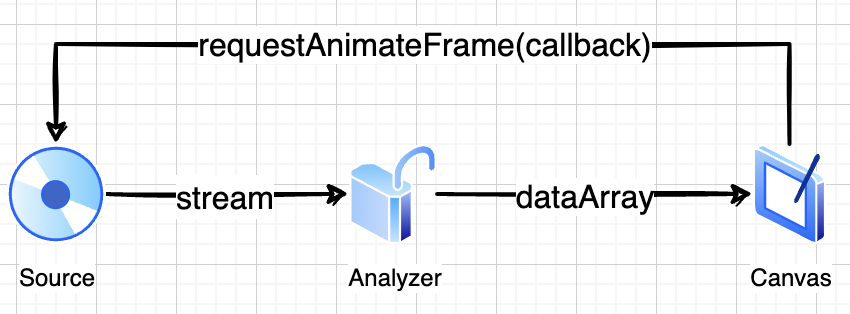
stream,通过中间的解析器分析出频率值 freqency,将这些频率值通过“长条”的方式绘制在 <canvas> 上,然后以此不断循环就可以实现这样的频谱动态图了。
根据上面的思路,我们首先要准备好这样的页面结构:
const Player: FC = () => {
  const {visualize} = useAudioVisualization('#canvas', 50);

  const audioRef = useRef<HTMLAudioElement>(null);

  const onPlay = async () => {
    if (audioRef.current) {
      await audioRef.current.play();
      const stream = (audioRef.current as any).captureStream();
      visualize(stream)
    }
  }

  return (
    <div className={styles.player}>
      <div className={styles.canvas}>
        <canvas id="canvas" width={500} height={300}/>
      </div>
      <div className={styles.controls}>
        <audio ref={audioRef} src={audioUrl} onPlay={onPlay} controls />
      </div>
    </div>
  )
}
useAudioVisualization
这里使用 React Hook 的方式来封装可视化逻辑:
const useAudioVisualization = (selector: string, length = 50) => {
  // 开始可视化
  const visualize = (stream: MediaStream) => {

  }

  return { visualize };
}
visualize
在拿到音频的流之后,我们就可以调用 Audio API 来创建解析器并分析音频了。
// 开始可视化
const visualize = (stream: MediaStream) => {
  const canvasEl: HTMLCanvasElement | null = document.querySelector(selector);
  if (!canvasEl) {
    throw new Error('找不到 canvas');
  }

  // 创建解析器
  audioCtxRef.current = new AudioContext()
  analyserRef.current = audioCtxRef.current.createAnalyser();

  // 获取音频源
  const source = audioCtxRef.current.createMediaStreamSource(stream);
  // 将音频源连接解析器
  source.connect(analyserRef.current);

  // 准备数据数组
  analyserRef.current.fftSize = 256;
  const bufferLength = analyserRef.current.frequencyBinCount;
  const dataArray = new Uint8Array(bufferLength);

  // 开始递归画图
  drawEachFrame(canvasEl, dataArray);
}
这里主要做了几件事:
- 通过
AudioContext创建analyser - 将音频输入源连接
analyser,每次播放的时候,音频都会经过analyser进行处理 - 设置
fft,从analyser获取音频频率数据dataArray
经过上面的操作我们已经拿到了音频的数据,接下来就是渲染 <canvas> 的时候了,开始实现 drawEachFrame。
drawEachFrame
我们日常所看到的动画本质上都是一个画面一个画面连续播放的效果。
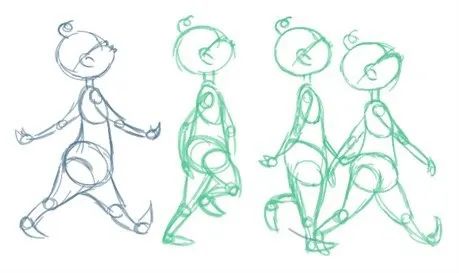
其实并不用这么复杂,这里给大家推荐一个 API requestAnimationFrame。它会以浏览器的显示频率来作为其动画动作的频率,比如浏览器每 10ms 刷新一次,动画回调也每 10ms 调用一次,这样就不会存在过度绘制的问题,动画不会掉帧,自然流畅。
只要我们在 requestAnimationFrame 的 callback 里不断地绘制 <canvas> 就可以获得一个流畅的频谱图了。
// 每个动画帧都画图
const drawEachFrame = (canvasEl: HTMLCanvasElement, dataArray: Uint8Array) => {
  // 递归调用
  requestAnimateFrameIdRef.current = requestAnimationFrame(() => drawEachFrame(canvasEl, dataArray));

  if (analyserRef.current) {
    // 读取当前帧新的数据
    analyserRef.current.getByteFrequencyData(dataArray);
    // 更新长度
    const bars = dataArray.slice(0, Math.min(length, dataArray.length));
    // 画图
    clearCanvas(canvasEl);
    // 绘制小浮块
    drawFloats(canvasEl, bars);
    // 绘制条状图
    drawBars(canvasEl, bars);
  }
}
上面的 drawEachFrame 里又调用了一次 requestAnimationFrame,以此来实现递归循环调用的效果。
这里我们还会把 requestAnimateFrameId 给记录下来,以防之后销毁时要调用 window.cancelAnimationFrame(id) 来清除。
clearCanvas
在绘制 <canvas> 前,我们先把它给清空一下:
export const clearCanvas = (canvasEl: HTMLCanvasElement) => {
  const canvasWidth = canvasEl.width;
  const canvasHeight = canvasEl.height;
  const canvasCtx = canvasEl.getContext("2d");

  if (!canvasCtx) {
    return;
  }

  // 绘制图形
  canvasCtx.fillStyle = 'rgb(29,19,62)';
  canvasCtx.fillRect(0, 0, canvasWidth, canvasHeight);
}
这样就能得到一个纯色的 “白板” 了:
drawBars
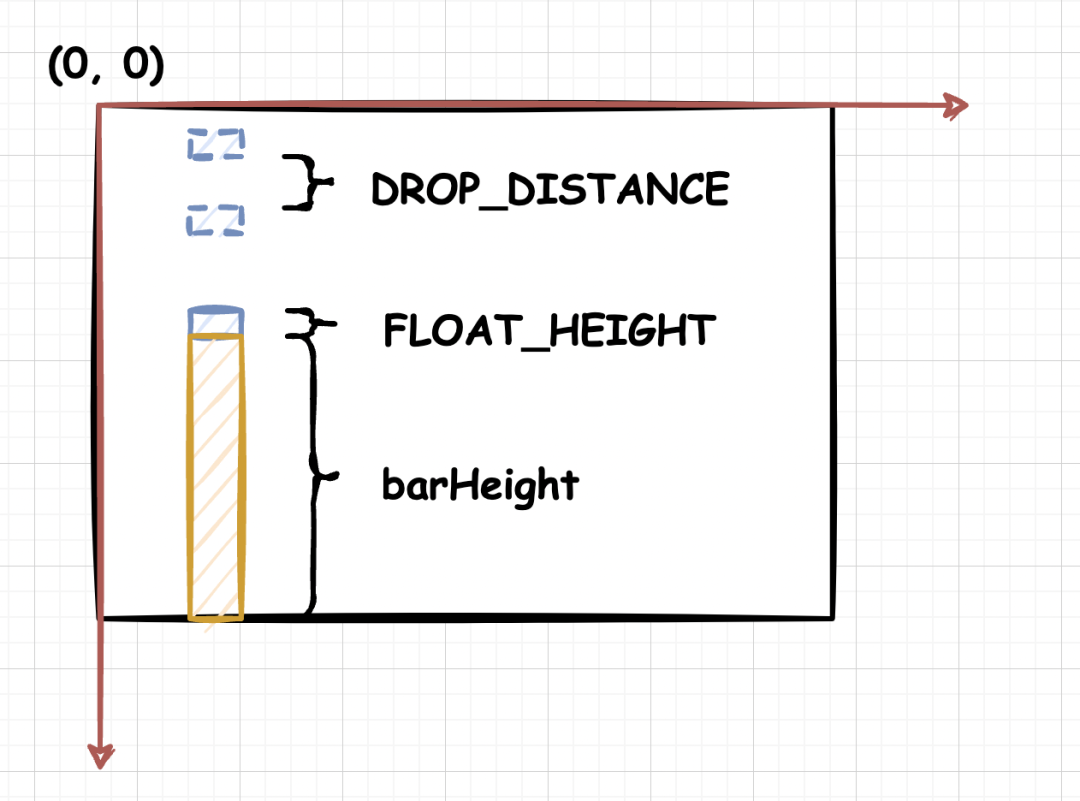
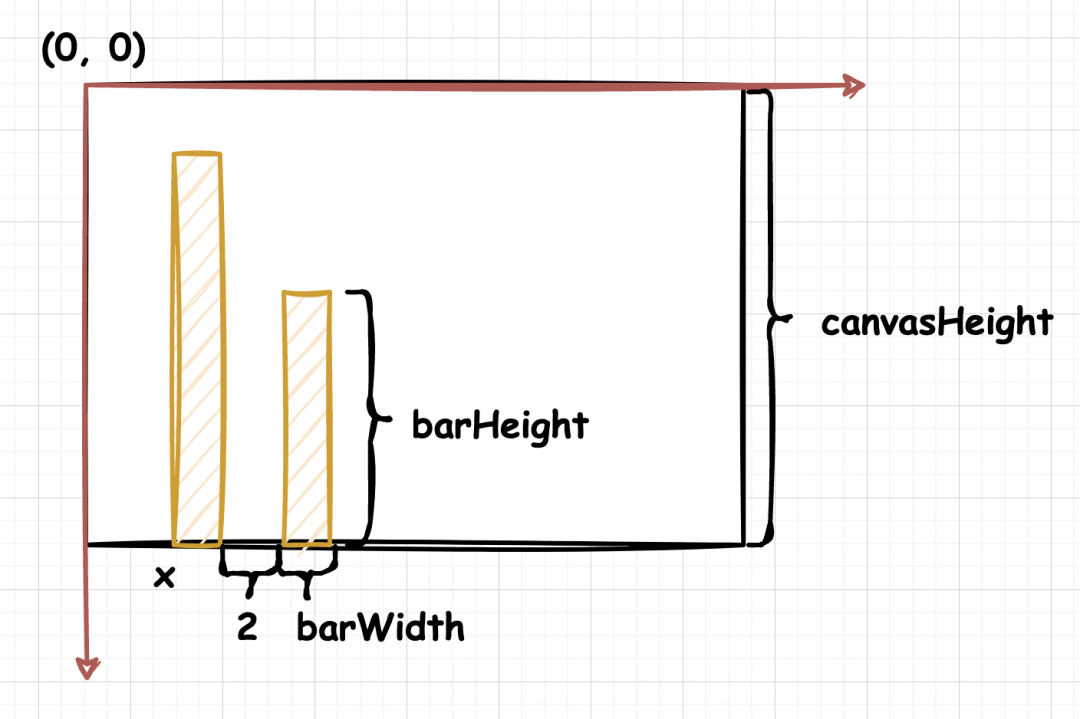
接下来实现条状图,图示:
// 浮动的小块
let floats: any = [];
// 高度
const FLOAT_HEIGHT = 4;
// 下落高度
const DROP_DISTANCE = 1;
// Bar 的 border 宽度
const BAR_GAP = 2;

export const drawBars = (canvasEl: HTMLCanvasElement, dataArray: Uint8Array) => {
  const canvasWidth = canvasEl.width;
  const canvasHeight = canvasEl.height;
  const canvasCtx = canvasEl.getContext("2d");

  if (!canvasCtx) {
    return;
  }

  const barWidth = canvasWidth / dataArray.length
  let x = 0;

  dataArray.forEach((dataItem) => {
    const barHeight = dataItem;

    // 添加渐变色
    const gradient = canvasCtx.createLinearGradient(canvasWidth / 2, canvasHeight / 2, canvasWidth / 2, canvasHeight);
    gradient.addColorStop(0, '#68b3ec');
    gradient.addColorStop(0.5, '#4b5fc9');
    gradient.addColorStop(1, '#68b3ec');

    // 画 bar
    canvasCtx.fillStyle = gradient;
    canvasCtx.fillRect(x, canvasHeight - barHeight, barWidth, barHeight);

    x += barWidth + BAR_GAP;
  })
}
这里有几个点要注意:
- 画长方形的时候,原点是在左上角,所以
y的值为canvasHeight - barHeight,即总高度 - 条形高度 - 画下一个 bar 的时候,需要
+ BORDER_WIDTH来空出一个空隙,不然 bar 就都黏在一起了 - 在
<canvas>中画渐变,需要用addColorStop来实现
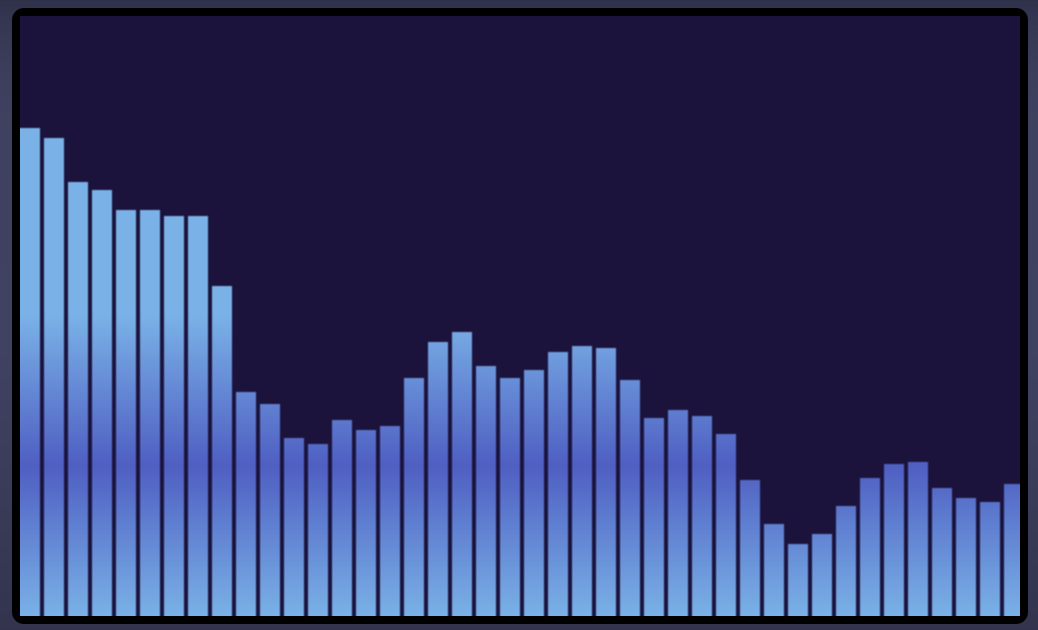
最后效果:
drawFloats
有了上面画条状 bar 的经验后,我们很容易就能想到怎么画这些小块了:

export const drawFloats = (canvasEl: HTMLCanvasElement, dataArray: Uint8Array) => {
  const canvasWidth = canvasEl.width;
  const canvasHeight = canvasEl.height;
  const canvasCtx = canvasEl.getContext("2d");

  if (!canvasCtx) {
    return;
  }

  // 找到最大值,以及初始化高度
  dataArray.forEach((item, index) => {
    // 默认值
    floats[index] = floats[index] || FLOAT_HEIGHT;
    // 处理当前值
    const pushHeight = item + FLOAT_HEIGHT;
    const dropHeight = floats[index] - DROP_DISTANCE;
    // 取最大值
    floats[index] = Math.max(dropHeight, pushHeight);
  })

  const barWidth = canvasWidth / dataArray.length;
  let x = 0;

  floats.forEach((floatItem: number) => {
    const floatHeight = floatItem;

    canvasCtx.fillStyle = '#3e47a0';
    canvasCtx.fillRect(x, canvasHeight - floatHeight, barWidth, FLOAT_HEIGHT);

    x += barWidth + BAR_GAP;
  })
}
这里最关键就是这个小浮块的高度,我们直接取浮想块下降了的高度 dropHeight 以及被 bar 推高的高度 pushHeight 他们两的最大值就可以了 floats[index] = Math.max(dropHeight, pushHeight)。
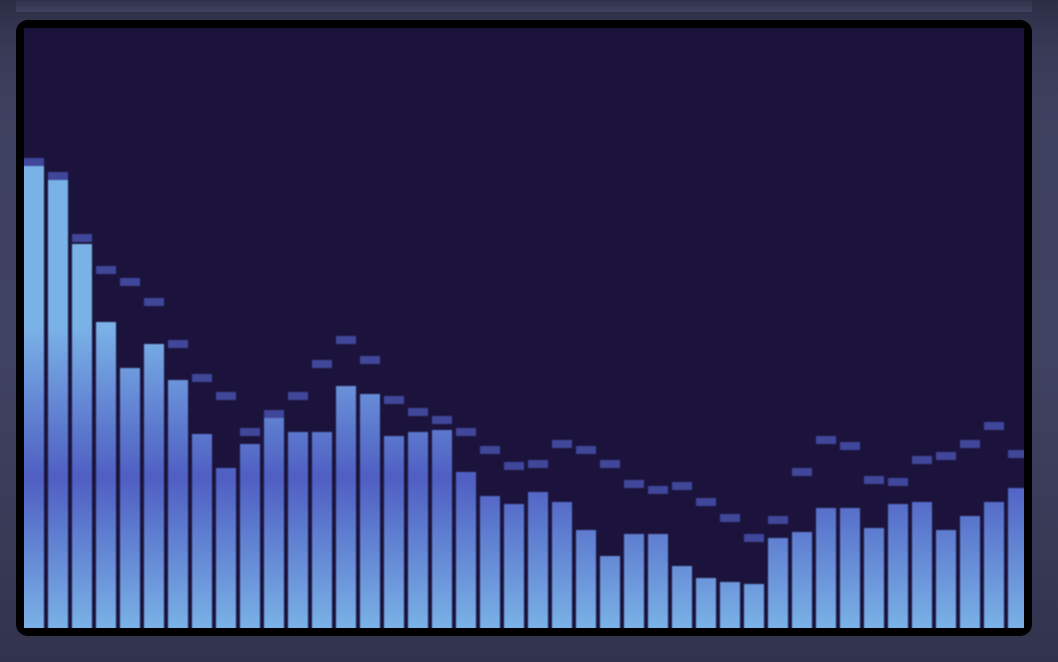
在实现好了之后,来一首试音原声大碟《渡口》,即可享受频谱图带来的快乐:
stopVisualize
有开始就有结束,由于这里动用了 <canvas>, requestAnimationFrame 这些资源,所以当组件销毁时应该清空他们:
const useAudioVisualization = (selector: string, length = 50) => {
  ...

  // 重置 canvas
  const resetCanvas = () => {
    const canvasEl: HTMLCanvasElement | null = document.querySelector(selector);
    if (canvasEl) {
      const emptyDataArray = (new Uint8Array(length)).map(() => 0);
      clearFloats();
      clearCanvas(canvasEl);
      drawFloats(canvasEl, emptyDataArray);
    }
  }

  // 停止
  const stopVisualize = () => {
    if (requestAnimateFrameIdRef.current) {
      window.cancelAnimationFrame(requestAnimateFrameIdRef.current);
      resetCanvas();
    }
  };

  return {
    visualize,
    stopVisualize,
    resetCanvas,
    requestAnimateFrameId: requestAnimateFrameIdRef.current
  };
}
这里我们也把 requestAnimateFrameId 扔出来,可由开发者自己处理。
完整的使用方式是这样的:
const Player = () => {
  const {visualize, stopVisualize, resetCanvas} = useAudioVisualization('#canvas', 50);

  const audioRef = useRef<HTMLAudioElement>(null);

  const onPlay = async () => {
    if (audioRef.current) {
      stopVisualize();
      await audioRef.current.play();
      const stream = (audioRef.current as any).captureStream();
      visualize(stream)
    }
  }

  const onPause = async () => {
    resetCanvas();
  }

  useEffect(() => {
    resetCanvas();
    return () => {
      stopVisualize()
    }
  }, []);

  return (
    <div className={styles.player}>
      <div className={styles.canvas}>
        <canvas id="canvas" width={500} height={300}/>
      </div>
      <div className={styles.controls}>
        <audio ref={audioRef} src={audioUrl} onPlay={onPlay} onPause={onPause} controls />
      </div>
    </div>
  )
}
更好看的样式就交给同学们自己实现了 :) 当然你也可以在 我的 Github 项目 里直接 Copy 我的丑陋样式。
总结
最后总结一下这个频谱图的实现:
- 使用 Audio API 创建
analyser,将音频流stream连接到analyser - 设置
analyser的fft参数,以此获取音频数据 - 通过递归调用
requestAnimationFrame来实现动画效果 - 使用 Canvas API 来绘制条形图以及小浮块,将这绘制操作放在
requestAnimationFrame的回调中,从而展示动态的频谱图
如果你看完还是做不出自己的千千静听,可以在 我的 Github 项目 里直接看源码实现。
参考资料
[1]Github 地址: https://github.com/haixiangyan/ttplayer
[2]预览地址: https://github.yanhaixiang.com/ttplayer/
