贝塞尔曲线轨迹运动原理与实战
本次分享大概分为下面几个方面
- 背景
- 贝塞尔曲线讲解
- 实现和探索过程
背景
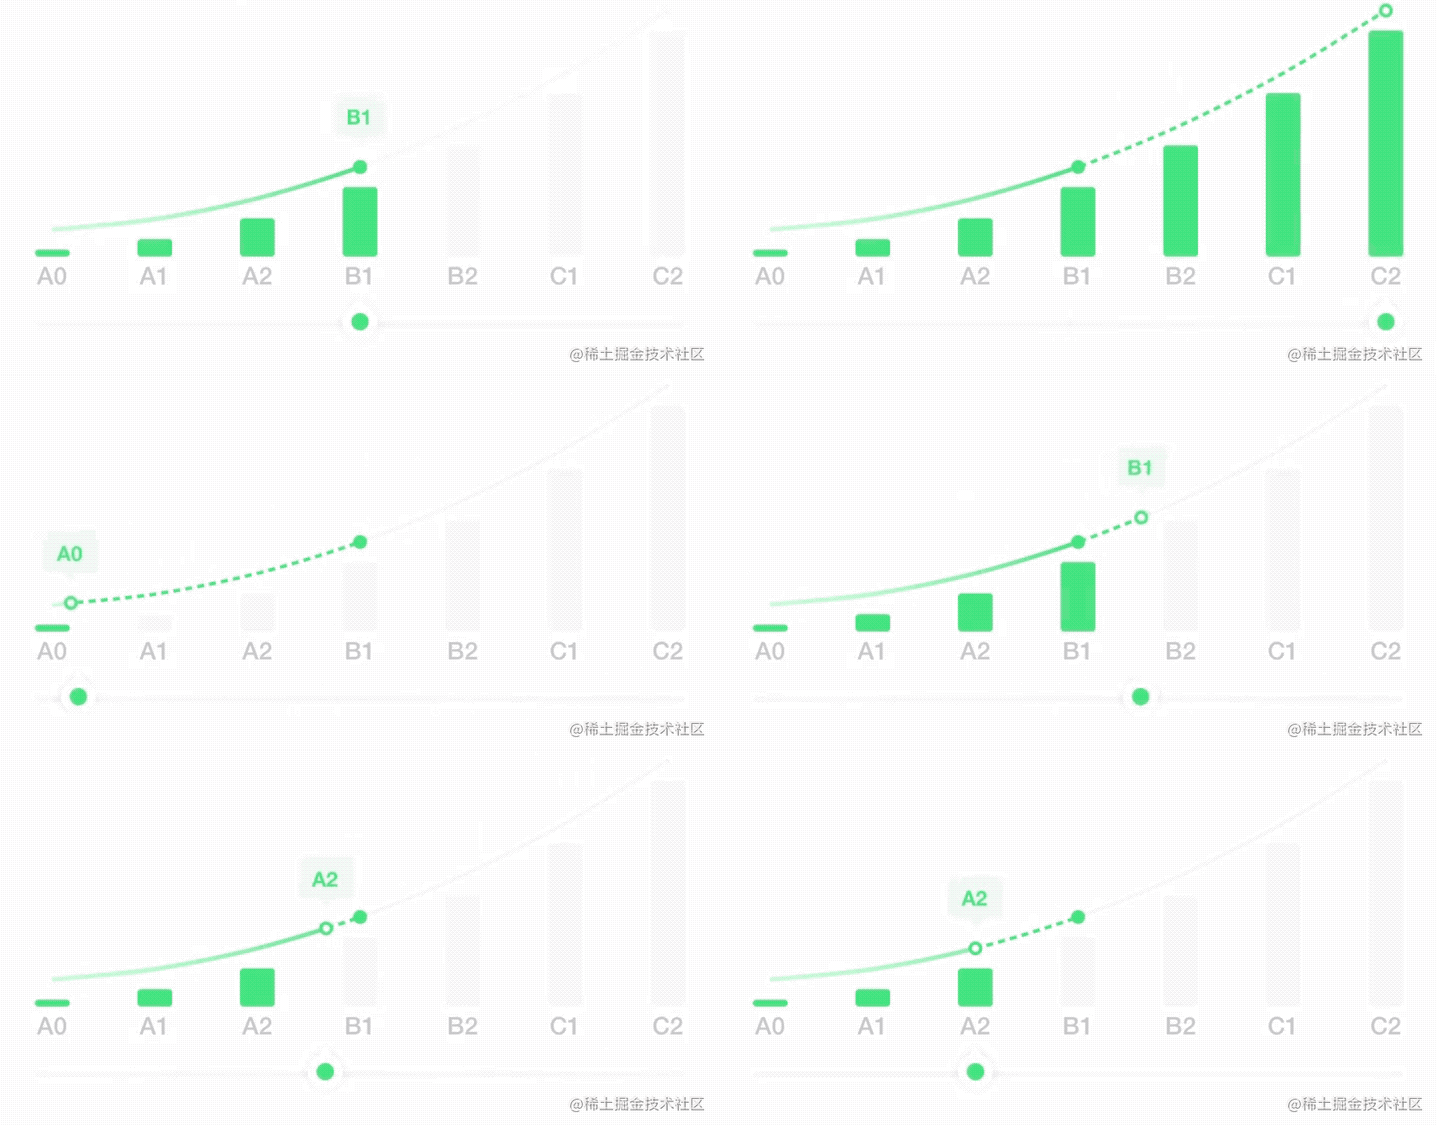
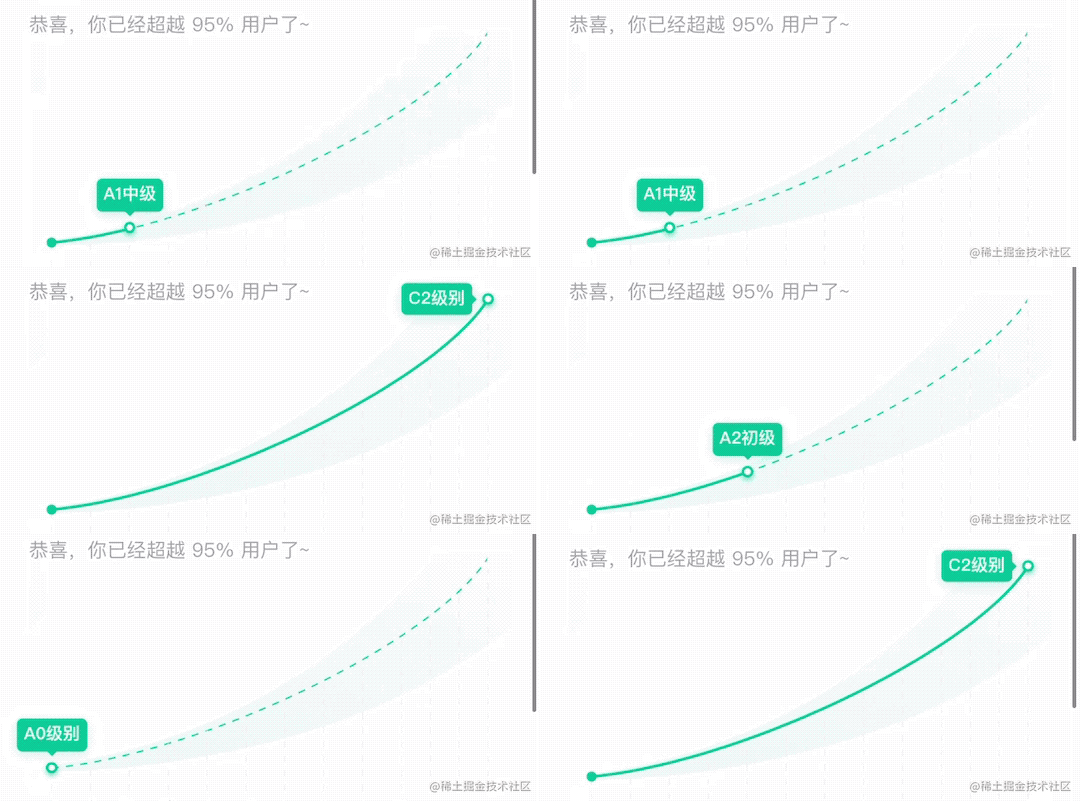
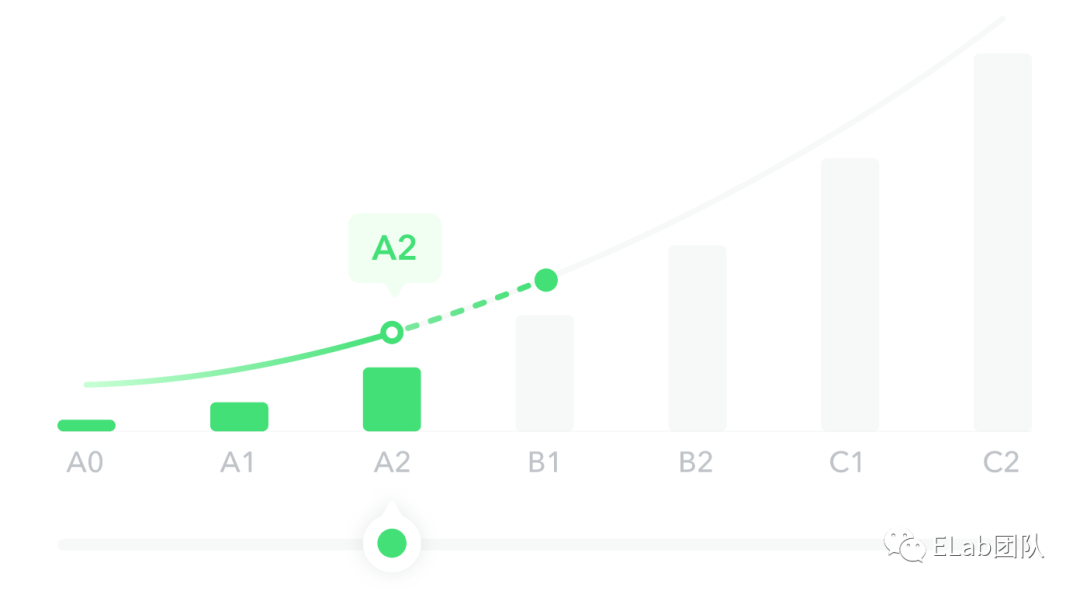
近期在 X 业务测评报告页有一个需求,用户可以左右拖动滑块来查看各个等级的信息。
在之前的野种中是通过切换图片的方式,会有卡顿的现象。由于 X 业务中等级区分比较少,等级间距更大,所以卡顿感会更大。
所以为了能够体现更丝滑的效果,使用svg画出贝塞尔曲线,动态控制实线和虚线的切换以及空心小球的位置。
svg中的path标签
<svg>
  <path
      stroke="red"
      fill="none"
      d="M 4,130 C 12.85,129.1 45.3,126.7 63,124 C 80.7,121.3 104.3,116.5 122,1                        12 C 139.7,107.5 163.3,100.3 181,94 C 198.7,87.7 222.3,78.10000000000001 240,70 C 257.7,61.9 281.3,49.900000000000006 299,40 C 316.7,30.1 349.15,9.400000000000004 358,4"></path>
</svg>
L- lineto -创建一条线.
H- horizontal lineto - 创建一条水平线.
V- vertical lineto - 创建一条竖线.
C- curveto - 创建(三阶)贝塞尔曲线到.
S- smooth curveto - 创建一条平滑曲线
Q- quadratic Bezier curve - 创建一个二次贝塞尔曲线
T- smooth quadratic Bezier curveto - 创建一个平滑二次贝塞尔曲线.
A- elliptical Arc - 创建一个椭圆弧.
Z- closepath - 关闭路径
上述命令使用大写字母,代表绝对路径,如果使用小写字母,则使用相对路径。
d="M 4,130 C 12.85,129.1 45.3,126.7 63,124".
贝塞尔曲线
贝塞尔曲线,由“线段”和节点组成,节点是可拖动的支点,表示曲线的趋向,“线段”像可伸缩的橡皮筋。它抽象了线段和曲线,通过控制路径上的四个点(起始点、终止点、两个中间点)来编辑图形;其中中间点和端点的连线称为控制线,这是一条虚拟的线段;两端的端点用来改变曲线的曲率;移动中间点来改变曲线运动轨迹。
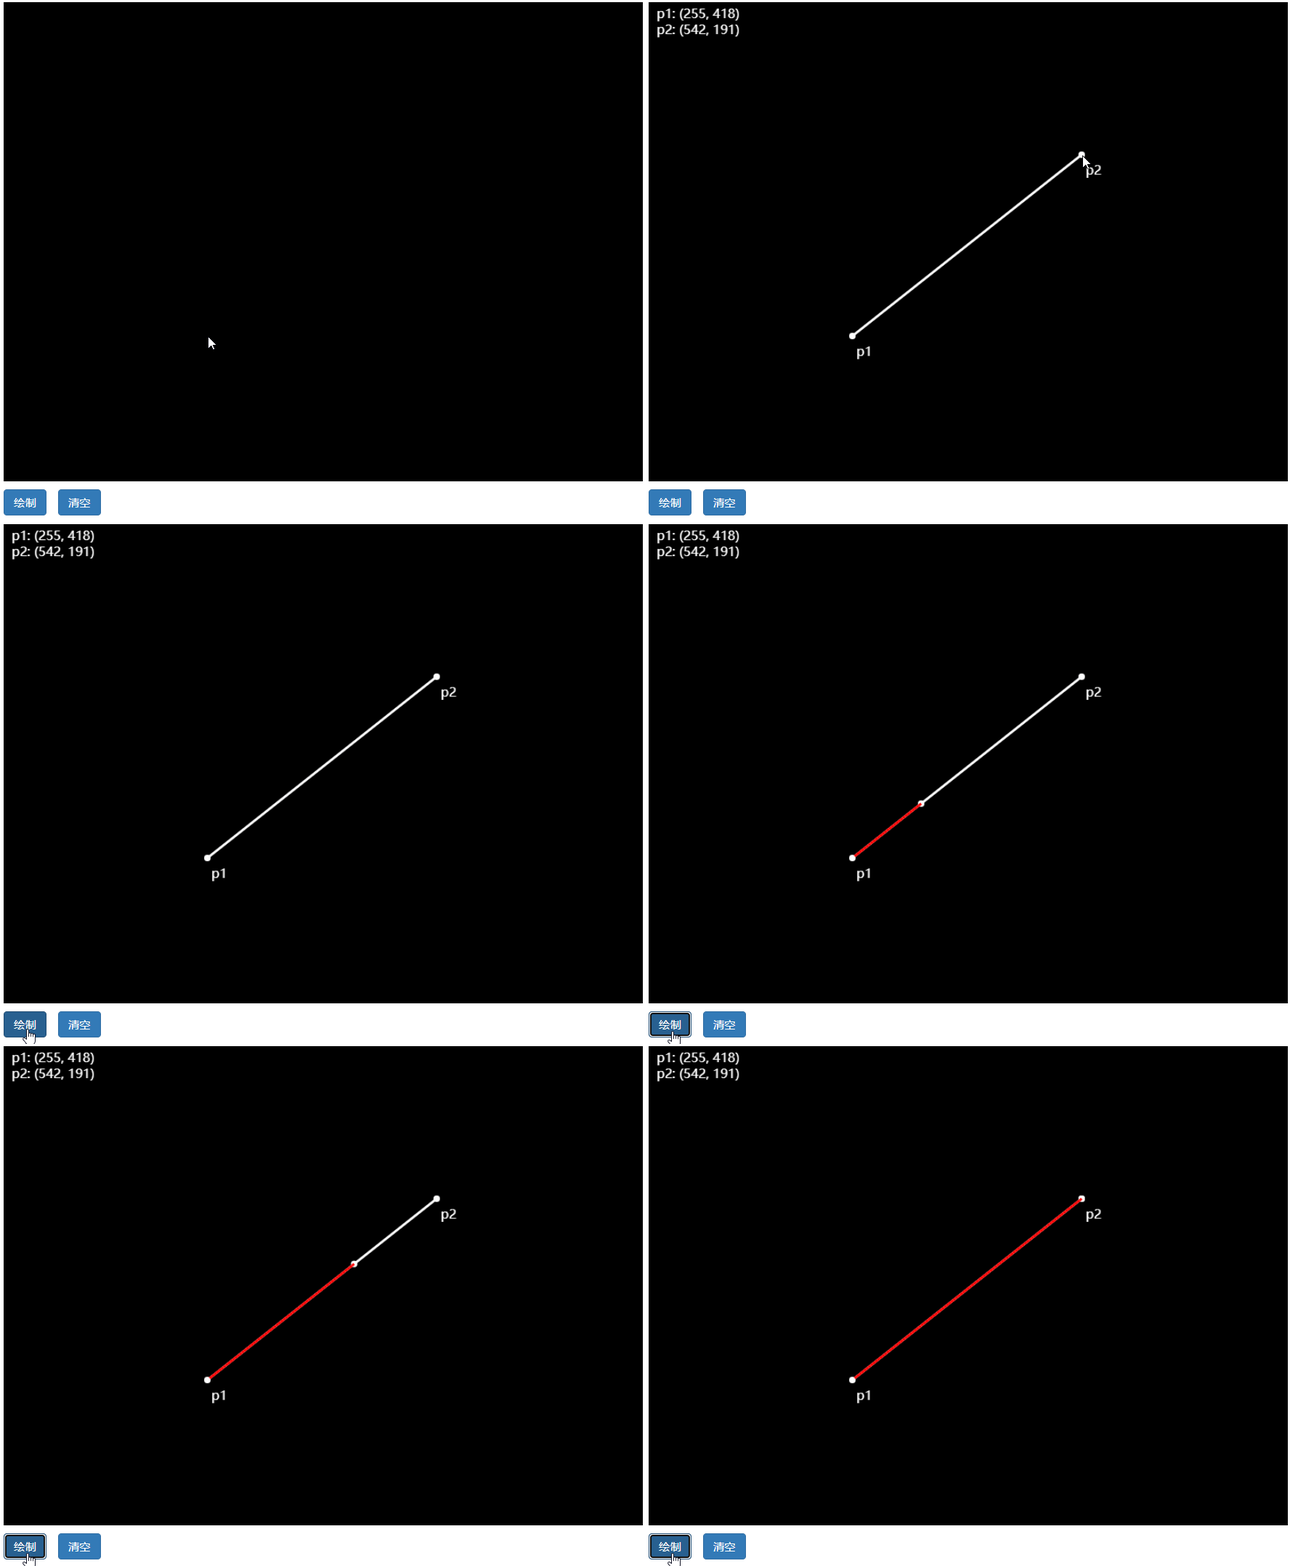
一阶贝塞尔曲线
公式:B(t) = P1 + (P2 − P1)t = P1(1−t)+ P2t, t∈[0,1]
二阶贝塞尔曲线
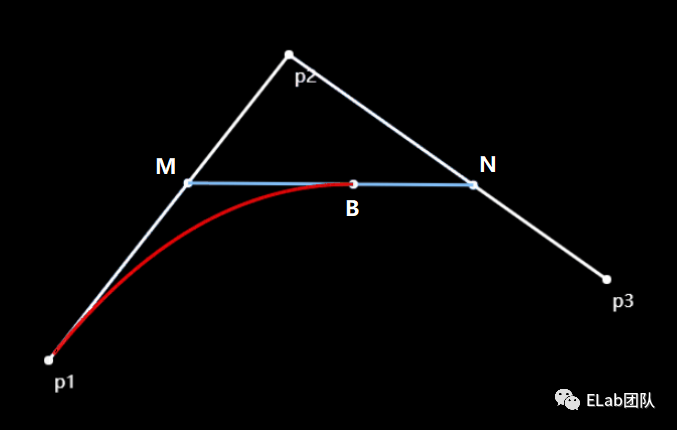
在平面内选3个不同线的点P1、P2、P3并且依次用线段连接,P1,P3为固定点,P2为支点(控制点)
公式:
M = P1(1-t)+P2t
N = P2(1-t)+P3t
B(t) = M(1-t)+Nt

三阶贝塞尔曲线
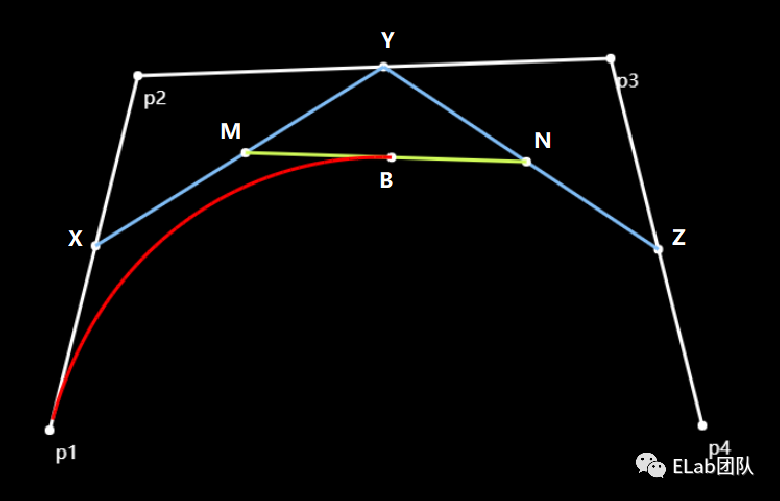
公式:
X(t) = P(1)(1 - t) + P(2)t
Y(t) = P(2)(1 - t) + P(3)t
Z(t) = P(3)(1 - t) + P(4)t
M(t) = X(1 - t) + Yt
N(t) = Y(1 - t) + Zt
B(t) = M(1 - t) + Nt
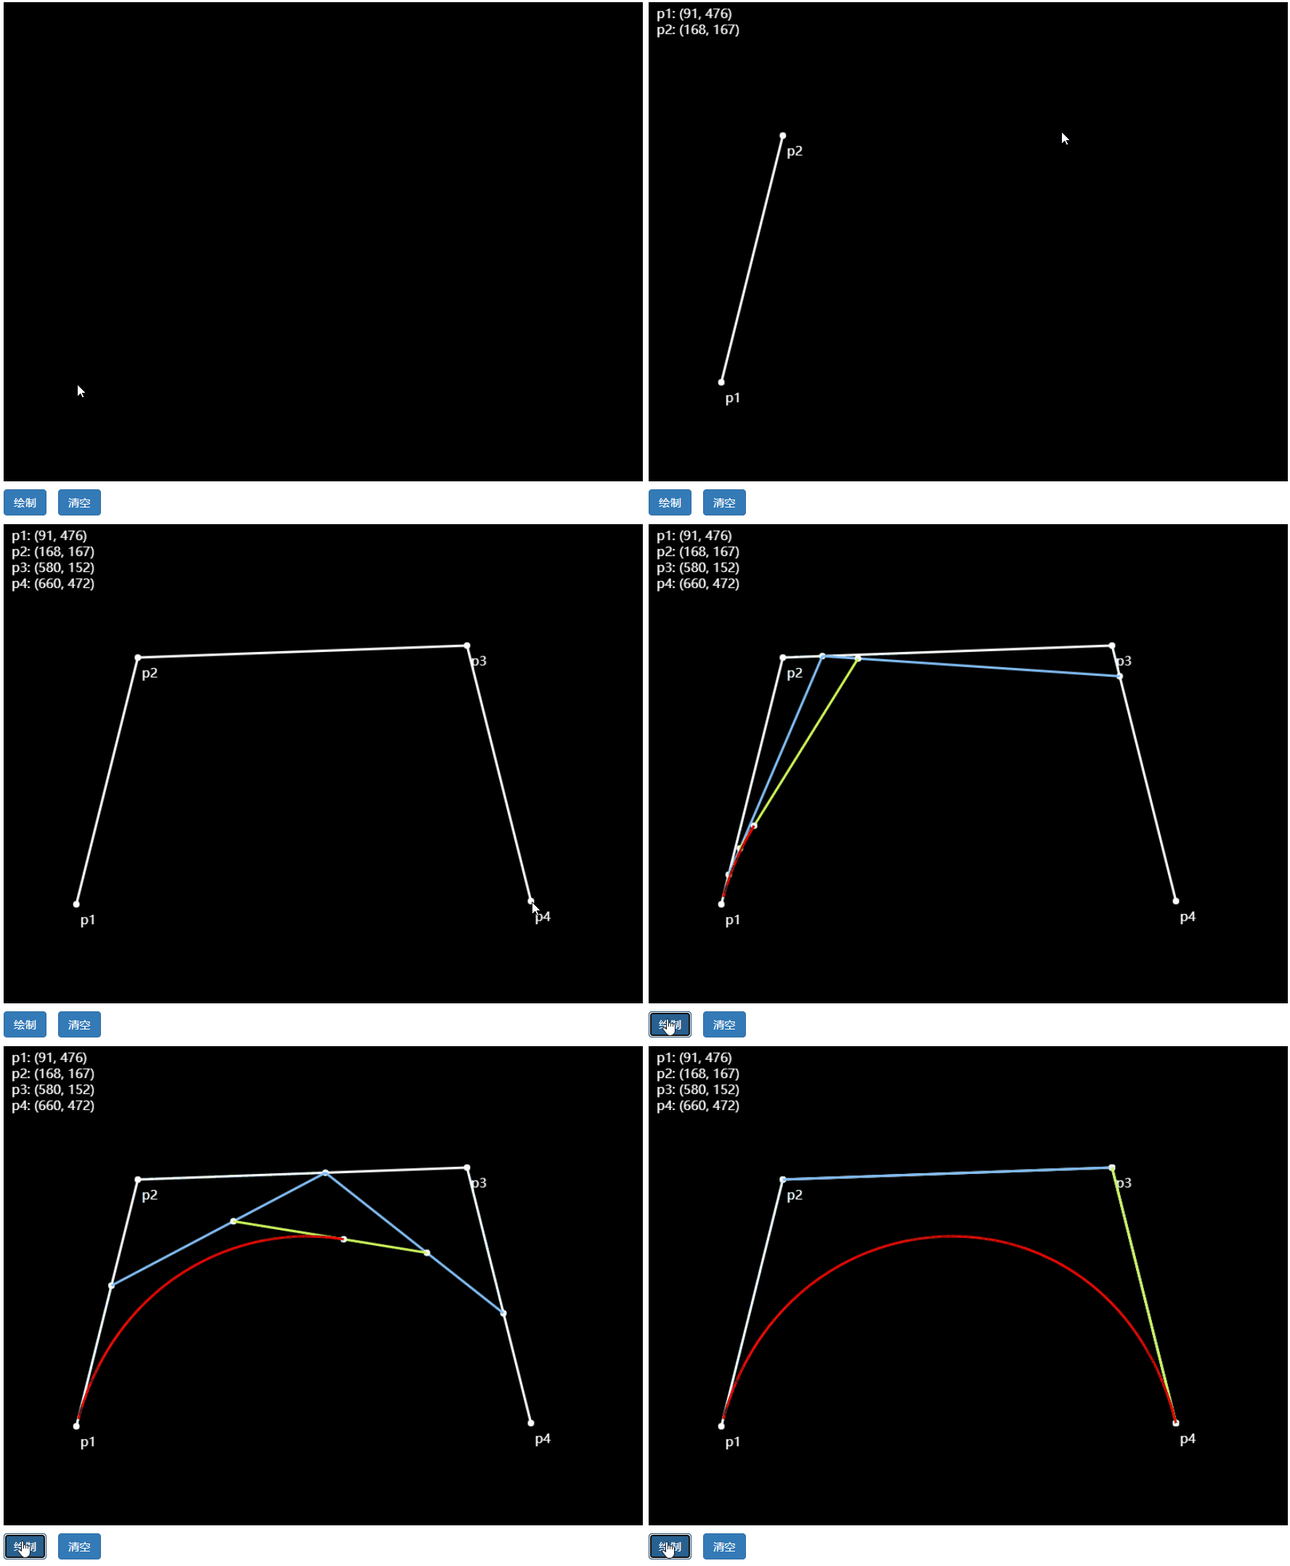
N阶贝塞尔曲线
在三阶贝塞尔曲线中,如何确定控制点
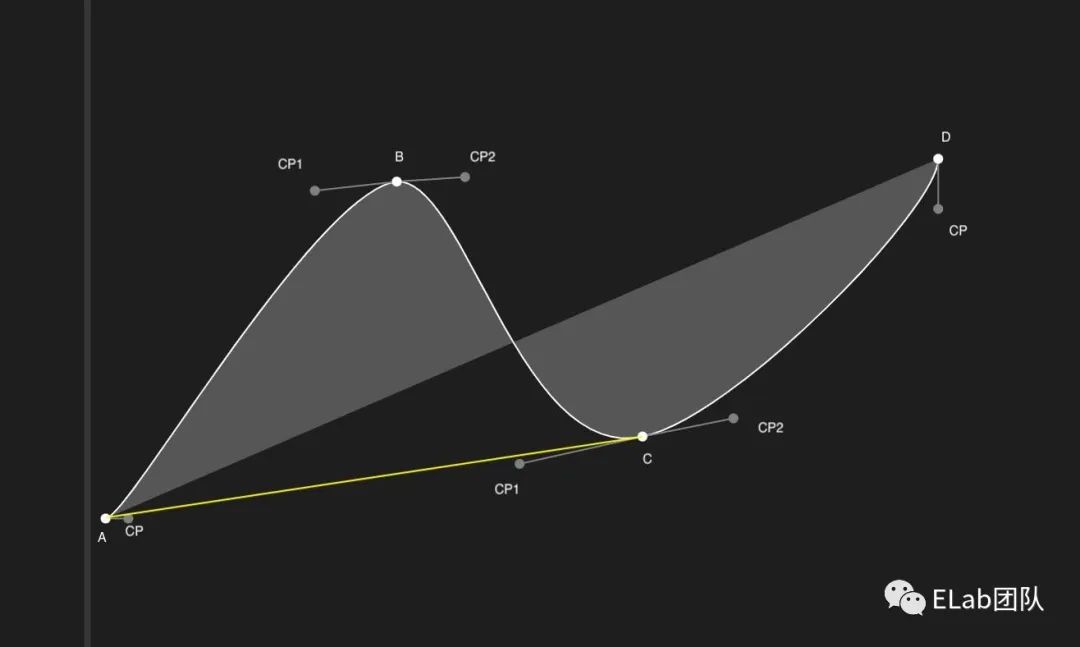
长度: 长度决定了曲线弧度的大小(宽窄),有一种计算方式可以使曲线弧度很自然。
AC的长度 * smoothing, smoothing = 0.15比较光滑
对于第一个点A,和最后一个点D的控制点,可以简单把AB的方向看作是A点的切线方向,长度为AB*smoothing。同理可知道点D附近的控制点
实现动效的难点
- 跟手变化的时候,实线和虚线的切换
- 空心小球在曲线上跟手移动
- 松手后,小球和曲线的动画
SVG基础
stroke-dasharray 和 stroke-dashoffset
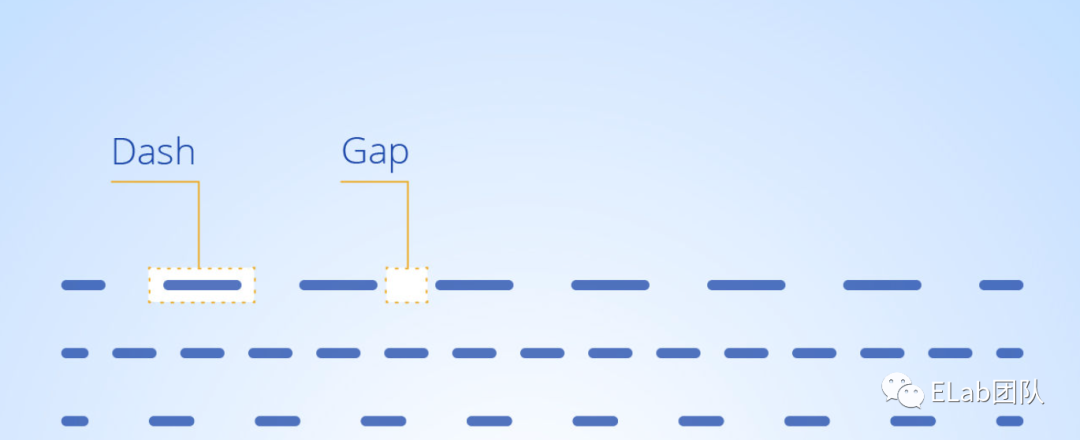
- stroke-dasharray:用于创建虚线
a . 如:stroke-dasharray = '10, 5' 表示:虚线(Dash)长10,间距(Gap)5,然后重复 虚线长10,间距5
b . 如:stroke-dasharray = '20, 10, 5' 表示:虚线长20,间距10,虚线长5,接着是间距20,虚线10,间距5,之后开始如此循环
2 . stroke-dashoffset:offset:偏移的意思
a . 这个属性是相对于起始点的偏移,正数偏移x值的时候,相当于往左移动了x个长度单位,负数偏移x的时候,相当于往右移动了x个长度单位。需要注意的是,不管偏移的方向是哪边,要记得dasharray 是循环的,也就是 虚线-间隔-虚线-间隔。这个属性要搭配stroke-dasharray才能看得出来效果,非虚线的话,是无法看出偏移的。
如:https://codepen.io/Josh_byte/pen/MWQVWKK[1]
Offset-path和offset-distance css属性
- 通过css属性offset-path可以指定元素不规则的动画路径
- offset-distance,是运动的距离,可以是数值或者百分比单位,如果是100%则表示正好把所有的路都跑完了。
如:https://codepen.io/Josh_byte/pen/PoQzjON[2]
参考:https://zhuanlan.zhihu.com/p/31242043[3]
兼容性
实现过程
step1 画贝塞尔曲线图
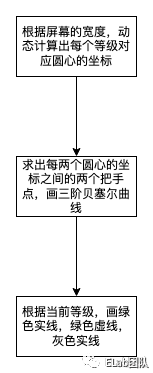
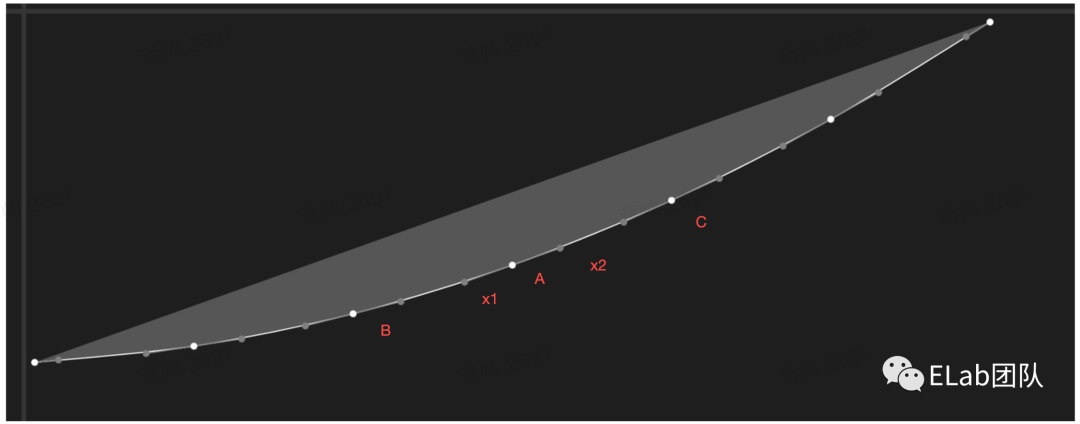
算圆心点坐标&把手坐标
//动态计算出的圆心坐标
const PointArray = [
[4, 130],
[63, 124],
[122, 112],
[181, 94],
[240, 70],
[299, 40],
[358, 4]
]


//算出当前点前一个点和后一个点的角度
const line = (pointA: number[], pointB: number[]) => {
    const lengthX = pointB[0] - pointA[0];
    const lengthY = pointB[1] - pointA[1];
    return {
      length: Math.sqrt(Math.pow(lengthX, 2) + Math.pow(lengthY, 2)),
      angle: Math.atan2(lengthY, lengthX),
    };
  };

//求每两个圆心坐标之间的两个把手
const controlPoint = (current: number[], previous: number[], next: number[], reverse: boolean) => {
    const p = previous || current;
    const n = next || current;
    const l = this.line(p, n);

    const angle = l.angle + (reverse ? Math.PI : 0);
    const length = l.length * BezierCurveAndCirclePoint.smoothing;
    const x = current[0] + Math.cos(angle) * length;
    const y = current[1] + Math.sin(angle) * length;
    return [x, y];
  };

const getBezierCurvePointArray = () => {
    const array: Point[][] = [];
    pointArray.forEach((item, i) => {
      if (i === 0) {
        return;
      }
      const cps = this.controlPoint(this.pointArray[i - 1], this.pointArray[i - 2], item, false);
      const cpe = this.controlPoint(item, this.pointArray[i - 1], this.pointArray[i + 1], true);
      array.push([
        {
          x: pointArray[i - 1][0],
          y: pointArray[i - 1][1],
        },
        {
          x: cps[0],
          y: cps[1],
        },
        {
          x: cpe[0],
          y: cpe[1],
        },
        {
          x: item[0],
          y: item[1],
        },
      ]);
    });
    return array;
};
绘制三条三阶贝塞尔曲线
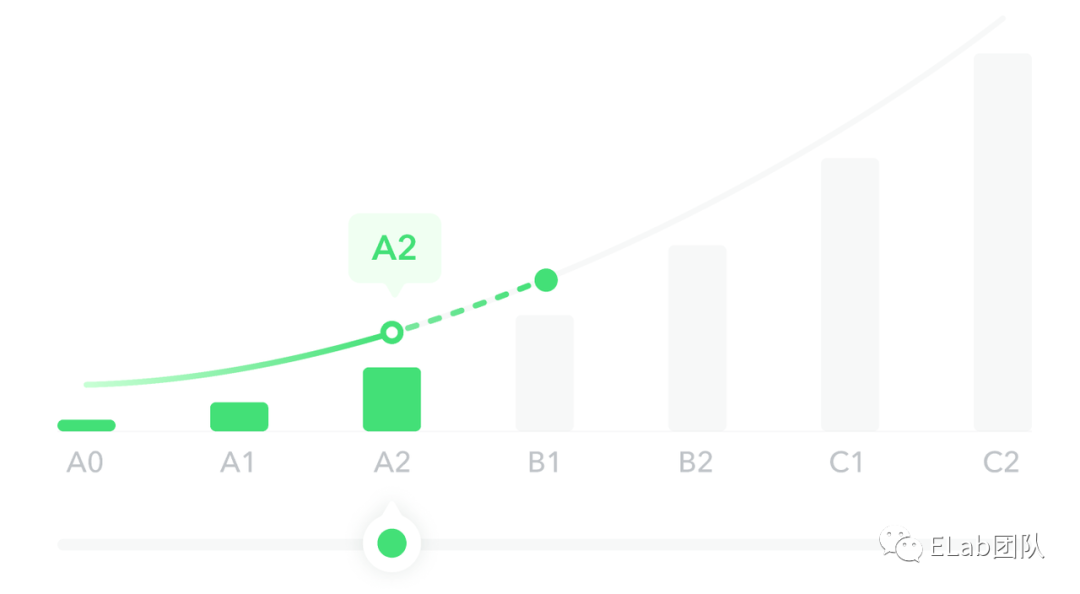
绿色实线变绿色虚线的过程可以看成,绿色实线往左偏移的过程(stroke-dashoffset)
灰色实线变绿色虚线的过程,可以看成,灰色实线往右偏移的过程。
绿色虚线,在最底层,没有变化。变化的是绿色和灰色实线
案例 https://codepen.io/Josh_byte/pen/bGLvKYM[4]
step2 求曲线弧长
如何判断stroke-dashoffset的距离?跟手移动2px,绿色实线或灰色实线移动多少?
stroke-dasharray的初始值设置为多少?
如何求三阶贝塞尔曲线函数的坐标

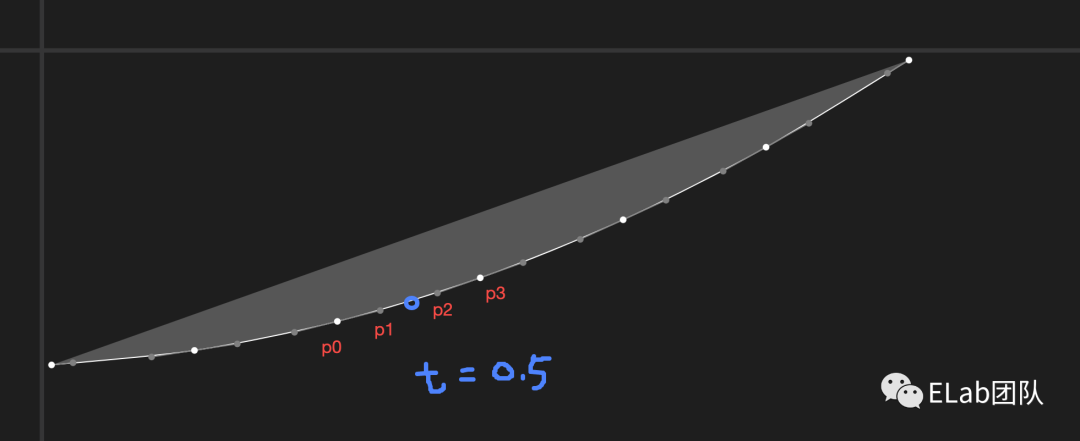
P1,P2是控制点
P3是终点坐标
t是百分比(在曲线位置的百分比)
const calculateCirclePoint = (t: number, PointArray: Point[]) => {
    const p0 = PointArray[0];
    const p1 = PointArray[1];
    const p2 = PointArray[2];
    const p3 = PointArray[3];
    const temp = 1 - t;
    const x =
      p0.x * temp * temp * temp +
      3 * p1.x * t * temp * temp +
      3 * p2.x * t * t * temp +
      p3.x * t * t * t;
    const y =
      p0.y * temp * temp * temp +
      3 * p1.y * t * temp * temp +
      3 * p2.y * t * t * temp +
      p3.y * t * t * t;
    return {
      x,
      y,
    };
  };
//举个例子,第一段曲线
const curvePoint =
[{x: 122, y: 112}, //起始点
{x: 139.7, y: 107.5}, //把手一
{x: 163.3, y: 100.3}, //把手二
{x: 181, y: 94}]。//终点
calculateCirclePoint(0.5,curvePoint)
如何求弧长
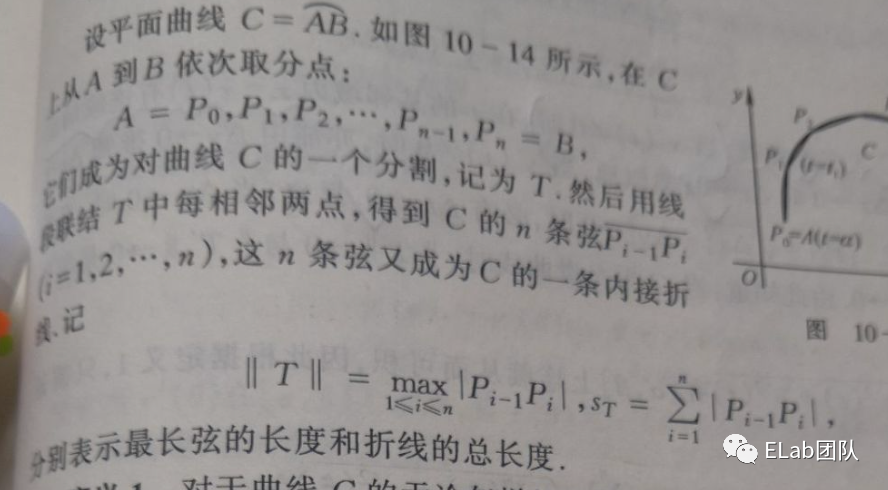
const cubicBezierLength = (PointArray: Point[], sampleCount?: number) => {
    const ptCount = sampleCount || 40;
    let totDist = 0;
    let lastX = PointArray[0].x;
    let lastY = PointArray[0].y;
    let dx;
    let dy;
    for (let i = 1; i < ptCount; i++) {
      const pt = this.calculateCirclePoint(i / ptCount, PointArray);
      dx = pt.x - lastX;
      dy = pt.y - lastY;
      totDist += Math.sqrt(dx * dx + dy * dy);
      lastX = pt.x;
      lastY = pt.y;
    }
    dx = PointArray[3].x - lastX;
    dy = PointArray[3].y - lastY;
    totDist += Math.sqrt(dx * dx + dy * dy);
    return Math.floor(totDist);
  };
完成以上两步,就可以实现曲线跟手移动的变化还有松手时候的动效了。
step3 实现空心小球跟手移动
由于offset-path属性在ios上不支持,只能实时求空心小球的实时坐标
step4 实现空心小球松手后的吸附动效
SVG SMIL animation
1 . animateMotion/
 <circle
    opacity={circleAnimationPointOpacity ? '1' : '0'}
    r="3"
    fill="#ffffff"
    strokeWidth="2"
    stroke="#43E077"
    >
            <animateMotion
              ref={circleAnimationRef}
              path={cirlceAnimationPath} //运动路径
              dur="200ms"   //持续时间
              keySplines="0.25 0.1 0.25 1" //动画时间曲线
              fill="freeze".    //结束后在原位置
              begin="indefinit".   //无限等待 开始用circleAnimationRef.current.beginElement()
              repeatCount="1".  //执行一次
            />
 </circle>
案列 https://codepen.io/Josh_byte/pen/oNEYpjO[5]
2 . 有两个空心绿色小球,一个小球是跟手移动的空心小球,还有一个是实现松手后动画的空心小球。
参考资料
[1]https://codepen.io/Josh_byte/pen/MWQVWKK: https://codepen.io/Josh_byte/pen/MWQVWKK
[2]https://codepen.io/Josh_byte/pen/PoQzjON: https://codepen.io/Josh_byte/pen/PoQzjON
[3]https://zhuanlan.zhihu.com/p/31242043: https://zhuanlan.zhihu.com/p/31242043
[4]https://codepen.io/Josh_byte/pen/bGLvKYM: https://codepen.io/Josh_byte/pen/bGLvKYM
[5]https://codepen.io/Josh_byte/pen/oNEYpjO: https://codepen.io/Josh_byte/pen/oNEYpjO
